
GraphSAGE,解决的就是GCN全图迭代时,大图场景无法训练的局限,在十万百万级别nodes大图训练时基本上都要用到的这个技巧。这么实用的技巧,光看原理,没动手写过肯定不够,踩坑实践一下理解才更透彻。
那怎么正确搭建一个GraphSAGE呢?
这篇文章就按三步法原则,从选邻居点,切子图、特征聚合出发,搭一个GraphSAGE的model。话不多说,喜闻乐见的show me the code环节。
絮叨一下GraphSAGE原理
搭之前,还是老规矩,得絮叨一下GraphSAGE基本原理,这个理论基础一定不能少,烂熟于心才能随心所欲,才知道代码怎么写。
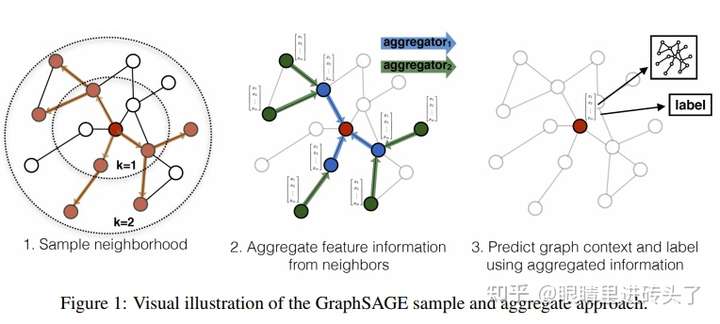
GraphSAGE的原理、优缺点在上面也写过了详细分析,这里就不在重复,只简单过一下基本流程原理。关于GCN的缺陷的及GraphSAGE的优势以及原理可以看这里图卷积:从GCN到GAT、GraphSAGE
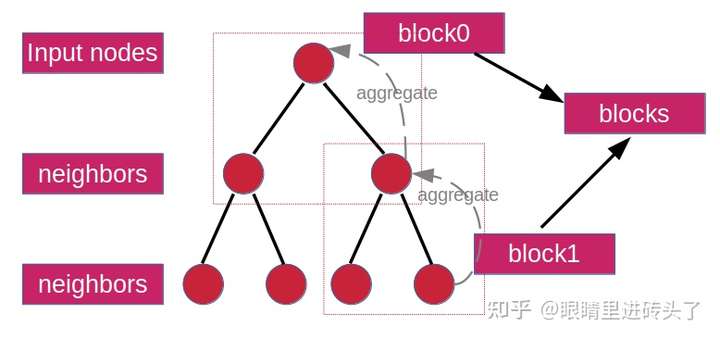
上面这张图很直观的描述了GraphSAGE,它将一个整图分割开,为每个节点建立一个子图,用来做聚合,然后得到input nodes的feature。比如上图红点是input node,则其他带颜色的点则为为input node sample出来的neighbors,从而得到一个子图,这个子图就是为做聚合,从而得到input node的聚合后的feature。
到这里,基本就可以梳理出搭一个GraphSAGE的基本步骤了,1.Dataloader:遍历nodes,作为input node。 2. 切子图:sample出input node的neighbors,构成子图 3. 模型:子图上特征聚合
三步法,开搭。
再给一张图,结合下面代码使用更方便。确定input nodes,以两层为例,sample出两层,每一层都组成一个子图block,n层则n个block,然后都装进blocks里即可,在做特征聚合时,依次遍历block从下往上逐层聚合,直到得到input nodes feature,然后再接上后续的任务如node classification就完成了。
1.Dataloader:遍历nodes,作为input node。
这里还是附带一个简单的dgl建图的demo(实际代码中图网络还是以cora,方便验证搭建正确性)。
import dgl
from torch.utils.data import Dataset
def build_graph_test(self):
    """a demo graph: just for graph test
    """
    src_nodes = torch.tensor([0, 0, 1, 1, 2, 2, 2, 3, 3, 3, 3, 4, 5, 6])
    dst_nodes = torch.tensor([1, 2, 0, 2, 0, 1, 3, 4, 5, 6, 2, 3, 3, 3])
    graph = dgl.graph((src_nodes, dst_nodes))
    return graph

def build_cora_dataset(add_symmetric_edges=True, add_self_loop=True):
    dataset = CoraGraphDataset()
    graph = dataset[0]

    # 加对称边
    if add_symmetric_edges:
        edges = graph.edges()
        graph.add_edges(edges[1], edges[0])
    # 加自循环边
    graph = dgl.remove_self_loop(graph)
    if add_self_loop:
        graph = dgl.add_self_loop(graph)
    return graph
NodeDataSet也比较简单,就是遍历所有train数据集中涉及的点作为input nodes就完了。
class HomoNodesSet(Dataset):
    def __init__(self, g, mask):
        # only load masked node for training/testing
        self.g = g
        self.nodes = g.nodes()[mask].tolist()

    def __len__(self):
        return len(self.nodes)

    def __getitem__(self, index):
        heads = self.nodes[index]
        return heads
2. 切子图:sample出input node的neighbors,构成子图
sample neighbors构成子图这块,应该是整个数据管道dataloader里的核心了。
这里把这一块,用一个call函数去实现,也就上面NodeSet出来的每个点,在这个回调类中去给它构建出子图来。最后dataloader主要是返回三个东西,分别是input nodes(batch), 子图中涉及all nodes(seeds), 以及子图(blocks)。
class NodesGraphCollactor(object):
    """
    select heads/tails/neg_tails's neighbors for aggregation
    """

    def __init__(self, g, neighbors_every_layer=[5, 1]):
        self.g = g
        self.neighbors_every_layer = neighbors_every_layer

    def __call__(self, batch):
        blocks, seeds = self.sample_blocks(batch)
        return batch, seeds, blocks

    def sample_blocks(self, seeds):
        blocks = []
        for n_neighbors in self.neighbors_every_layer:
            frontier = dgl.sampling.sample_neighbors(
                self.g,
                seeds,
                fanout=n_neighbors,
                edge_dir='in')
            block = self.compact_and_copy(frontier, seeds)
            seeds = block.srcdata[dgl.NID]  # 这里应该返回这一层的src node
            blocks.insert(0, block)
        return blocks, seeds

    def compact_and_copy(self, frontier, seeds):
        # 将第一轮的dst节点与大的图frontier压缩成小图  block
        # 并设置block的seeds 为 output nodes,其他为input nodes
        block = dgl.to_block(frontier, seeds)
        for col, data in frontier.edata.items():
            if col == dgl.EID:
                continue
            block.edata[col] = data[block.edata[dgl.EID]]
        return block
3. 模型:子图上特征聚合
在得到上述的input nodes、子图blocks后,就可以搭GraphSAGE聚合网络了。
怎么个聚合法,参考论文也就是下面这个地方,先聚合邻居node feature,然后concat起来,经过个激活函数,就得到input node feature了,最后输出在做一个normalize,即完成。
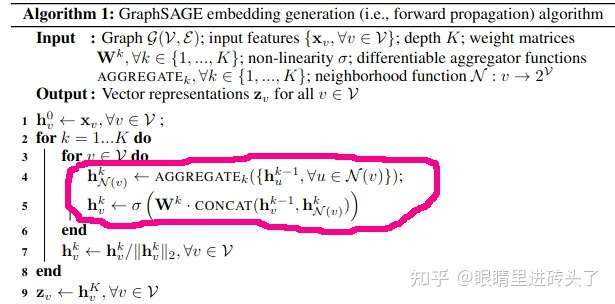
定义好维度转换矩阵Q, 模型参数W(这里加了bias, 不加bias模型抖动的很厉害,不易收敛)。
class WeightedSAGEConv(nn.Module):
    def __init__(self, input_dims, output_dims, act=F.relu, dropout=0.5, bias=True):
        super().__init__()

        self.act = act
        self.Q = nn.Linear(input_dims, output_dims)
        self.W = nn.Linear(input_dims + output_dims, output_dims)
        if bias:
            self.bias = Parameter(torch.FloatTensor(output_dims))
        else:
            self.register_parameter('bias', None)
        # self.dropout = nn.Dropout(dropout)
        self.reset_parameters()

    def reset_parameters(self):
        """init Q, W and bias"""
        ......

    def forward(self, g, h, weights=None):
        h_src, h_dst = h
        with g.local_scope():
            g.srcdata['n'] = self.Q(h_src)
            g.update_all(fn.copy_src('n', 'm'), fn.mean('m', 'neigh'))  # aggregation or pool:fn.max()
            n = g.dstdata['neigh']
            z = self.act(self.W(torch.cat([n, h_dst], 1))) + self.bias
            z_norm = z.norm(2, 1, keepdim=True)
            z_norm = torch.where(z_norm == 0, torch.tensor(1.).to(z_norm), z_norm)
            z = z / z_norm
            return z
当然GraphSAGE也可以跟GCN一样,进行多层aggregate的,上面可以作为多层GraphSAGE的一个基础子layer,一个多层GraphSAGE就很容易了。
class SAGENet(nn.Module):
    def __init__(self, input_dim, hidden_dims, output_dims,
                 n_layers, act=F.relu, dropout=0.5):
        super().__init__()
        self.convs = nn.ModuleList()
        self.convs.append(WeightedSAGEConv(input_dim, hidden_dims, act, dropout))
        for _ in range(n_layers - 2):
            self.convs.append(WeightedSAGEConv(hidden_dims, hidden_dims,
                                               act, dropout))
        self.convs.append(WeightedSAGEConv(hidden_dims, output_dims,
                                           act, dropout))
        self.dropout = nn.Dropout(dropout)
        self.act = act

    def forward(self, blocks, h):
        for l, (layer, block) in enumerate(zip(self.convs, blocks)):
            h_dst = h[:block.number_of_nodes('DST/' + block.ntypes[0])]
            h = layer(block, (h, h_dst))
            if l != len(self.convs) - 1:
                h = self.dropout(h)
        return h
实验结果:
cora数据集的node Classification任务。
Test accuracy ~0.781(0.762-0.801) (paper: 0.815)
内容中包含的图片若涉及版权问题,请及时与我们联系删除
评论
沙发等你来抢