
奇月 发自 凹非寺
量子位 | 公众号 QbitAI
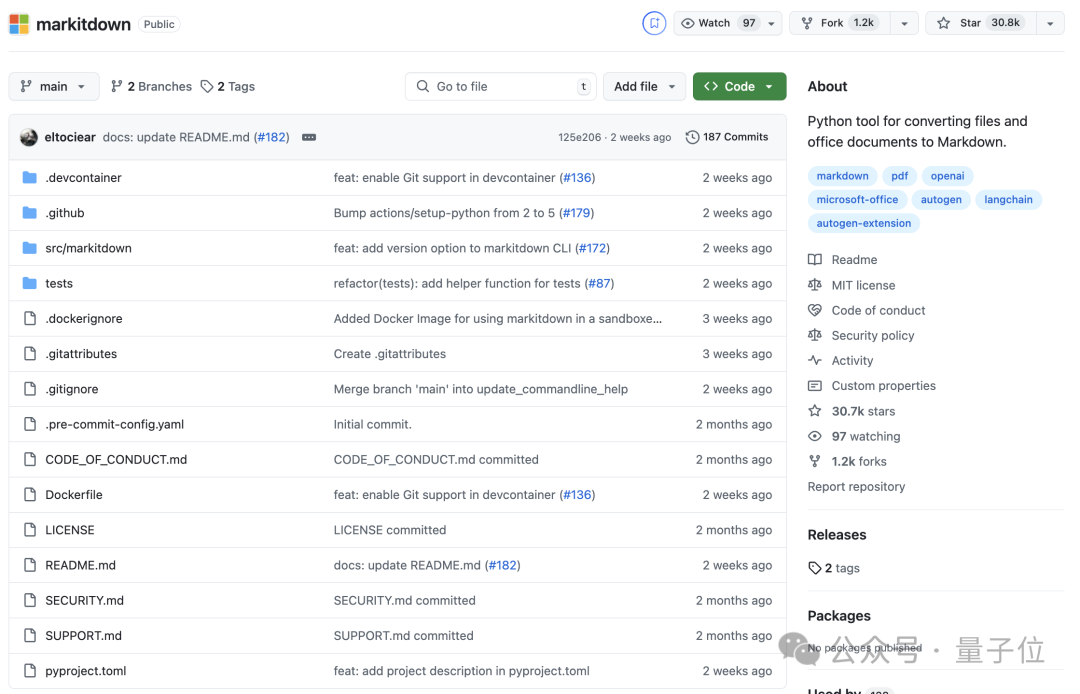
微软官方开源了一款文件格式转换工具——MarkItDown!
它不仅可以将常见的Office文档(Word、PowerPoint、Excel)、PDF、图像、音频等转换为对大模型更友好的Markdown格式。
而且还支持集成像GPT-4o这样的多模态LLM,可以直接对图片、音频文件进行更高级的处理,比如快速输出商业报告。
以后开发者们上传训练数据、微调LLM应用都更方便了。
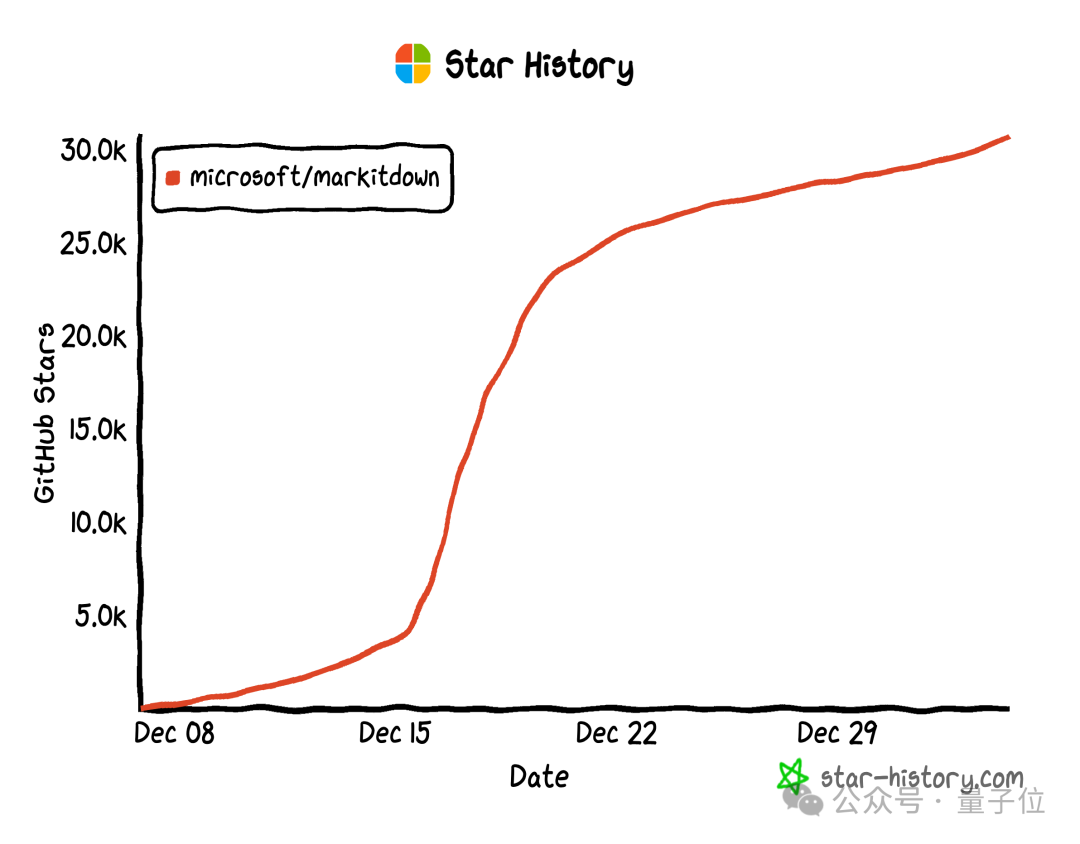
发布仅两个月,它的GitHub收藏数就超过了3万。
具体来说,它支持的文件格式包括:
PDF
PowerPoint
Word
Excel
图像(含OCR和EXIF元数据)
音频(含EXIF元数据和转录)
HTML
其他基于文本的格式(CSV, JSON, XML)
压缩包
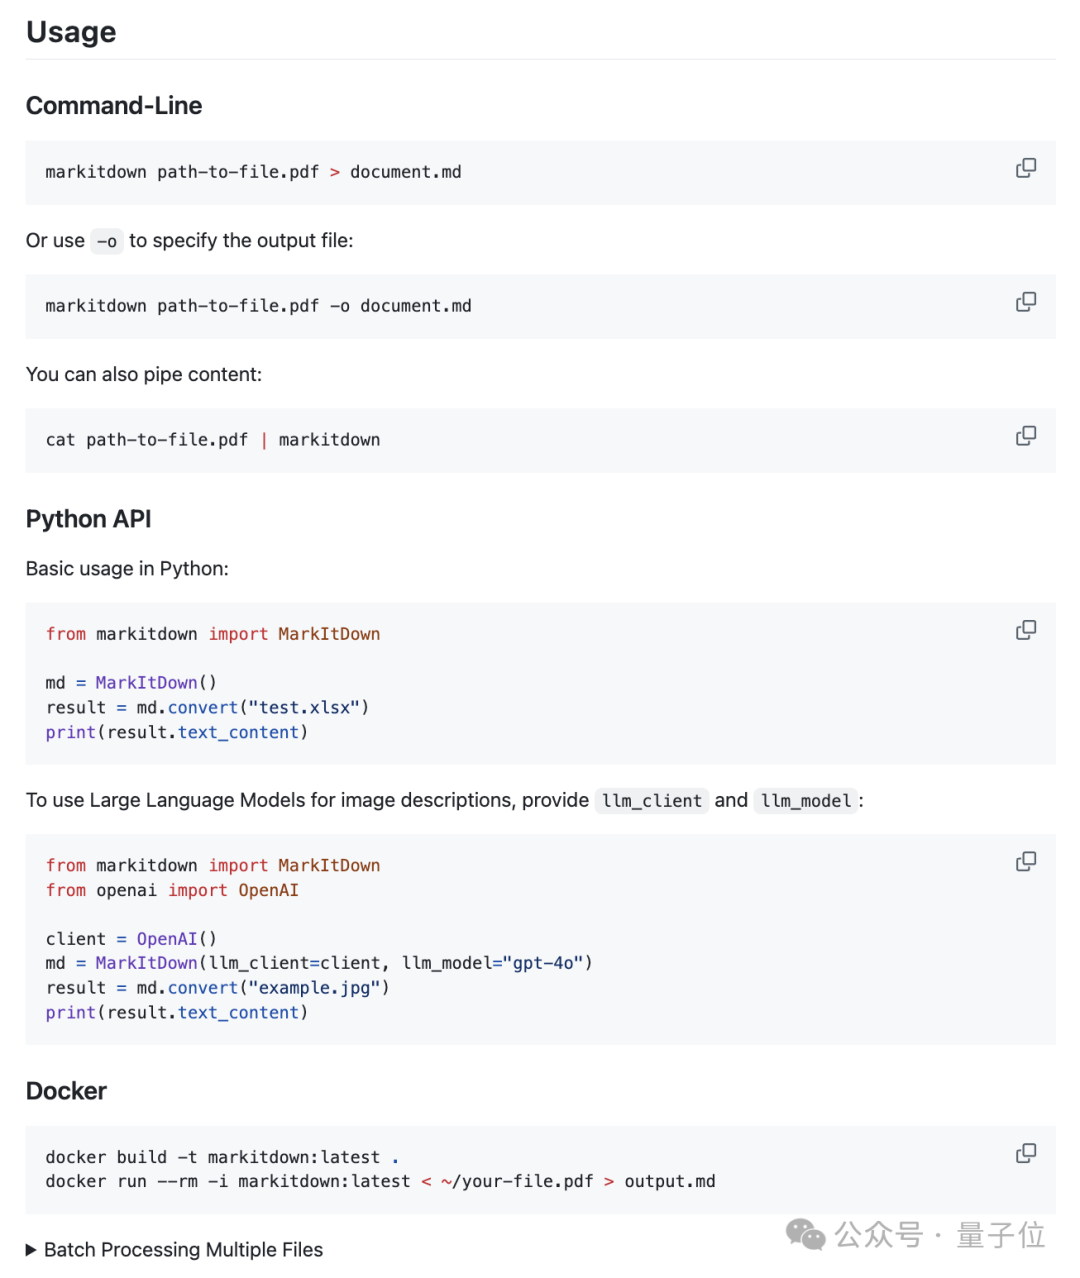
使用方式上,MarkItDown提供了命令行、Python API以及Docker三种形式。
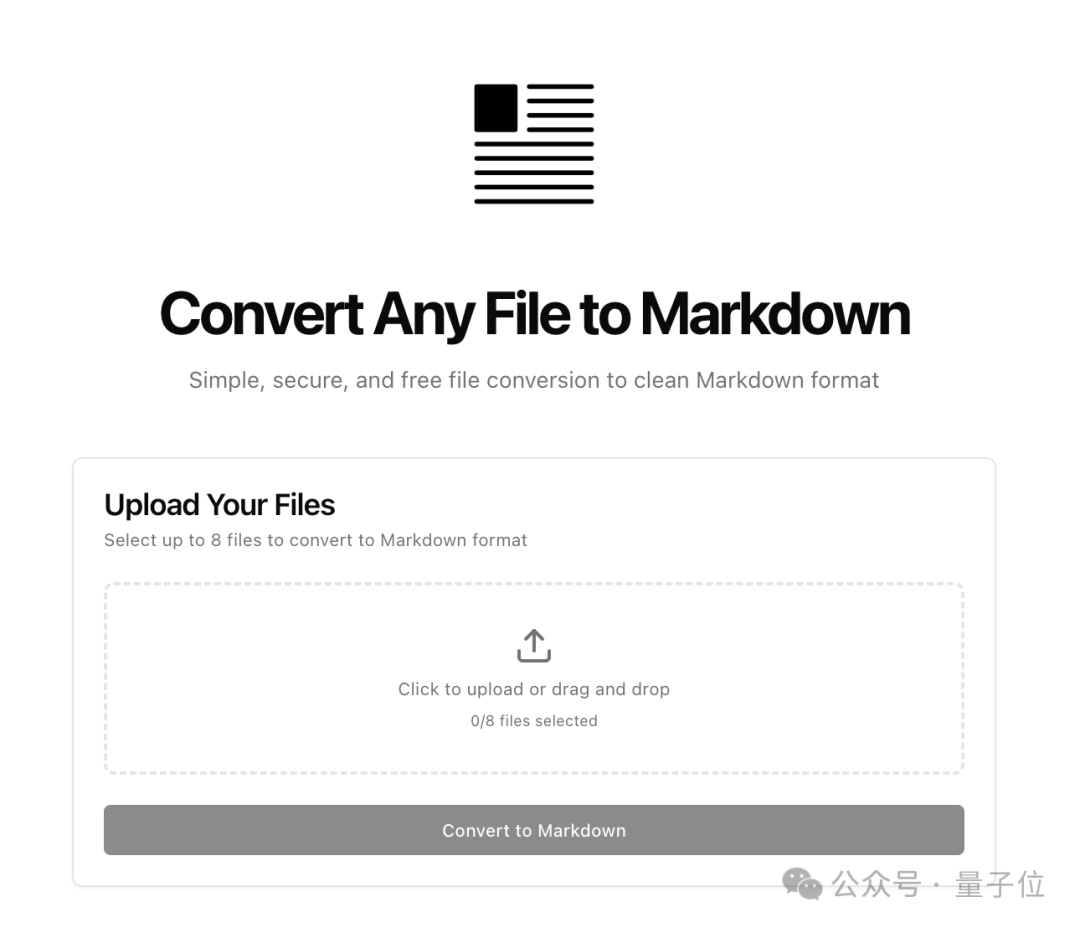
热心网友Aark Kodur还制作了在线版的网页应用,点开网址就能直接试用。
可接多模态LLM直接生成报告
哥伦比亚大学讲师Tharsis用一个证券报告分析任务测试了MarkItDown的性能,同时也将它与IBM的热门Markdown转换库Docling进行了对比,一起来看看吧。
首先看看两个库的基本信息。
MarkItDown是由微软AutoGen团队开发的Python包和CLI,用于将各种文件格式转换为Markdown。
它支持包括PDF、PowerPoint、Word、Excel、图像(含 OCR 和 EXIF 元数据)、音频(含转录)、HTML以及其他基于文本的格式,是文档索引和构建基于LLM应用程序的有用工具。
主要特点:
简单命令行和Python API接口
支持多种文件格式
可集成LLM增强图像描述
支持批处理能力
支持Docker容器化使用
使用示例:
from markitdown import MarkItDownmd = MarkItDown()result = md.convert("test.xlsx")print(result.text_content)
Docling是由IBM研究院开发的Python包,用于解析和将文档转换为各种格式。
它提供高级文档理解能力,重点在于保持文档结构和格式。
主要特点:
支持多种文档格式(PDF、DOCX、PPTX、XLSX、图片、HTML 等)
高级PDF解析,包括布局分析和表格提取
统一的文档表示格式
集成LlamaIndex和LangChain
支持OCR分析扫描文档
简单命令行界面
使用示例:
from docling.document_converter import DocumentConverterconverter = DocumentConverter()result = converter.convert("document.pdf")print(result.document.export_to_markdown())
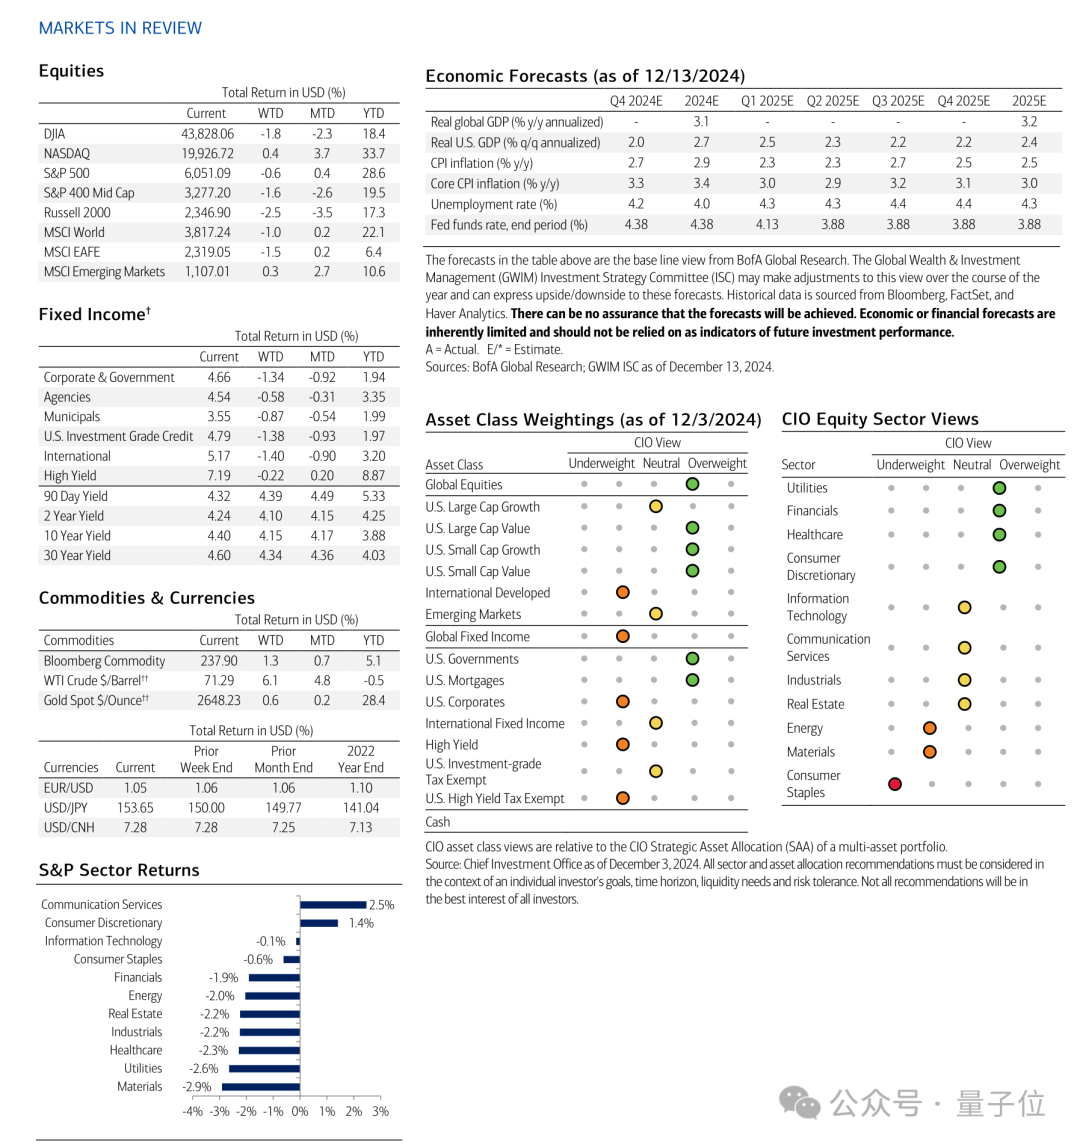
本案例研究将主要从美林证券(Merrill Lynch)于2024年12月16日发布的首席信息官资本市场展望中提取经济预测。
我们将主要关注该文档的第7页,其中包含多个经济变量,这些变量以表格、文本和图像的混合形式组织。
FORECAST_FILE_PATH = "../data/input/forecast.pdf"首先,我们将使用MarkItDown从文档中提取文本内容。
from markitdown import MarkItDownmd = MarkItDown()result_md = md.convert(FORECAST_FILE_PATH).text_content
接下来,我们使用Docling进行同样的操作。
from docling.document_converter import DocumentConverterconverter = DocumentConverter()forecast_result_docling = converter.convert(source).document.export_to_markdown()
这两个结果有多相似?
我们可以使用Levenshtein距离来衡量两个结果之间的相似度。
还可以使用difflib包中的SequenceMatcher来计算一个简单的分数,这是基于最长公共子序列中匹配数来衡量两个字符串相似度的一个简单度量。
import Levenshteindef levenshtein_similarity(text1: str, text2: str) -> float:"""Calculate normalized Levenshtein distanceReturns value between 0 (completely different) and 1 (identical)"""distance = Levenshtein.distance(text1, text2)max_len = max(len(text1), len(text2))return 1 - (distance / max_len)from difflib import SequenceMatcherdef simple_similarity(text1: str, text2: str) -> float:"""Calculate similarity ratio using SequenceMatcherReturns value between 0 (completely different) and 1 (identical)"""return SequenceMatcher(None, text1, text2).ratio()
下面是Levenshtein和SequenceMatcher的具体分数:
levenshtein_similarity(forecast_result_md, forecast_result_docling)0.13985705461925346simple_similarity(forecast_result_md, forecast_result_docling)0.17779960707269155结果显示,这两个结果非常不同,Levenshtein和SequenceMatcher的相似度得分分别为约13.98%和17.77%。
Docling的结果是一份相当易读的Markdown,展示了关键经济变量及其预测。
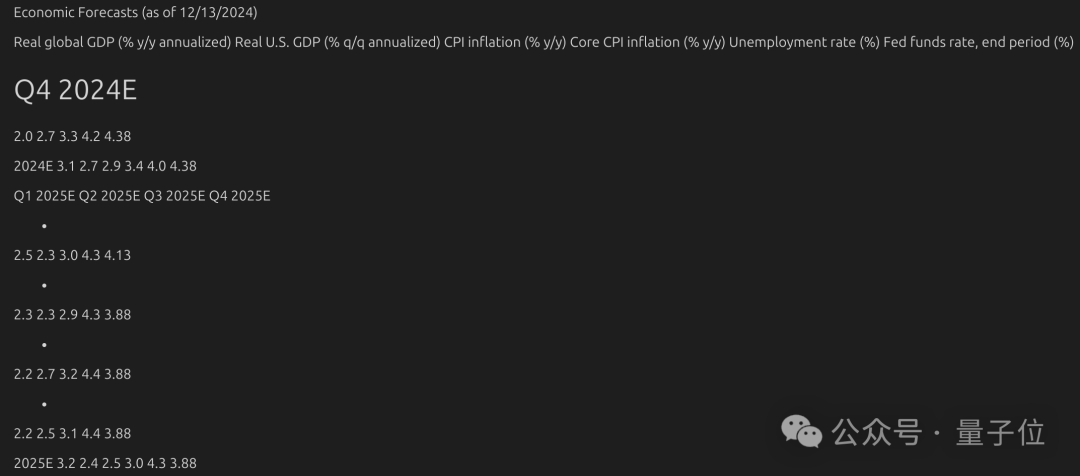
相反,MarkItDown的结果有些杂乱,难以阅读,但信息确实存在,只是没有以结构化的格式呈现。
但是,这重要吗?
先来看看Docling的结果:
display(Markdown(forecast_result_docling))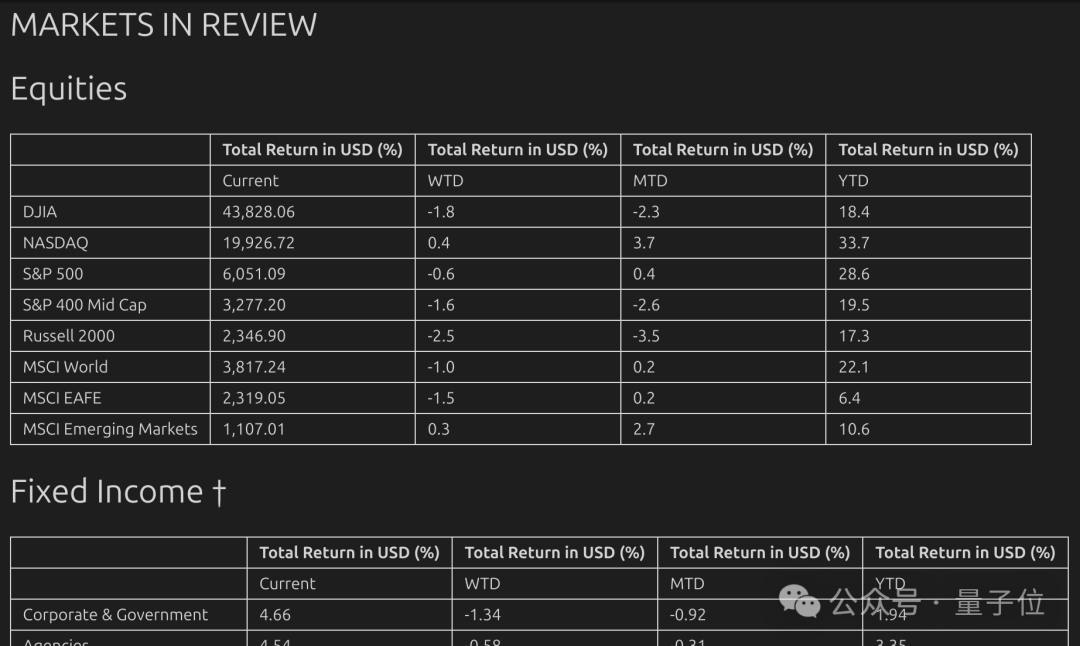
MarkItDown的结果:
from IPython.display import display, Markdowndisplay(Markdown(forecast_result_md[:500]))
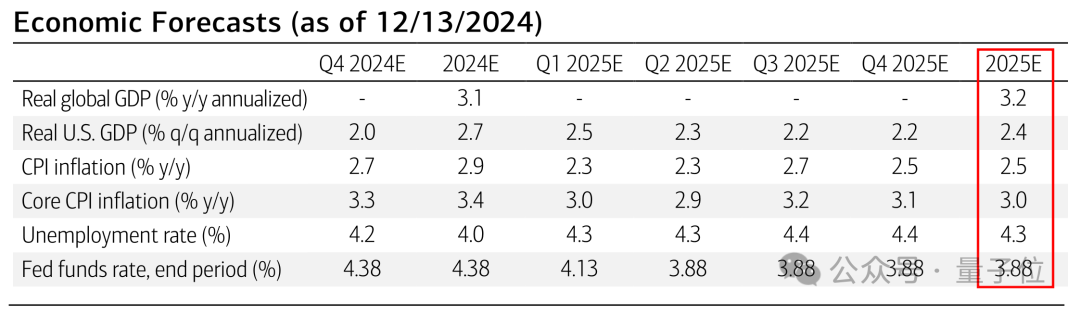
现在,让我们看一下经济预测的结果,主要关注提取CIO的2025E预测。
我们将定义一个Forecast pydantic模型来表示由financial_variable和financial_forecast组成的经济预测。
定义另外一个EconForecast pydantic模型来表示我们想要从文档中提取的经济预测列表。
from pydantic import BaseModelclass Forecast(BaseModel):financial_variable: strfinancial_forecast: floatclass EconForecast(BaseModel):forecasts: list[Forecast]
以下为提示模板,其中extract_prompt是用户希望提取的数据, doc是待分析的输入文档。
BASE_PROMPT = f"""ROLE: You are an expert at structured data extraction.TASK: Extract the following data {extract_prompt} from input DOCUMENTFORMAT: The output should be a JSON object with 'financial_variable' as key and 'financial_forecast' as value."""prompt = f"{BASE_PROMPT} \n\n DOCUMENT: {doc}"
我们编写了一个简单的函数,使用LLM模型(具有结构化输出)从文档中提取经济预测
def extract_from_doc(extract_prompt: str, doc: str, client) -> EconForecast:"""Extract data of a financial document using an LLM model.Args:doc: The financial document text to analyzeclient: The LLM model to use for analysisextract_prompt: The prompt to use for extractionReturns:EconForecasts object containing sentiment analysis results"""BASE_PROMPT = f"""ROLE: You are an expert at structured data extraction.TASK: Extract the following data {extract_prompt} from input DOCUMENTFORMAT: The output should be a JSON object with 'financial_variable' as key and 'financial_forecast' as value."""prompt = f"{BASE_PROMPT} \n\n DOCUMENT: {doc}"completion = client.beta.chat.completions.parse(model="gpt-4o-mini",messages=[{"role": "system","content": prompt},{"role": "user", "content": doc}],response_format=EconForecast)return completion.choices[0].message.parsed
from dotenv import load_dotenvimport os# Load environment variables from .env fileload_dotenv(override=True)from openai import OpenAIclient = OpenAI()
然后,用户调用extract_from_doc函数,简单地定义“2025E 经济预测”是他们想要从文档中提取的数据。
我们执行提取两次,一次使用MarkItDown,一次使用Docling。
extract_prompt = "Economic Forecasts for 2025E"md_financials = extract_from_doc(extract_prompt, forecast_result_md, client)docling_financials = extract_from_doc(extract_prompt, forecast_result_docling, client)
响应是一个包含Forecast对象列表的EconForecast对象,如pydantic模型中定义的那样。
md_financialsEconForecast(forecasts=[Forecast(financial_variable='Real global GDP (% y/y annualized)', financial_forecast=3.2), Forecast(financial_variable='Real U.S. GDP (% q/q annualized)', financial_forecast=2.4), Forecast(financial_variable='CPI inflation (% y/y)', financial_forecast=2.5), Forecast(financial_variable='Core CPI inflation (% y/y)', financial_forecast=3.0), Forecast(financial_variable='Unemployment rate (%)', financial_forecast=4.3), Forecast(financial_variable='Fed funds rate, end period (%)', financial_forecast=3.88)])然后我们可以将响应转换为pandas DataFrame格式,以便于比较。
df_md_forecasts = pd.DataFrame([(f.financial_variable, f.financial_forecast) for f in md_financials.forecasts],columns=['Variable', 'Forecast'])df_docling_forecasts = pd.DataFrame([(f.financial_variable, f.financial_forecast) for f in docling_financials.forecasts],columns=['Variable', 'Forecast'])
df_md_forecasts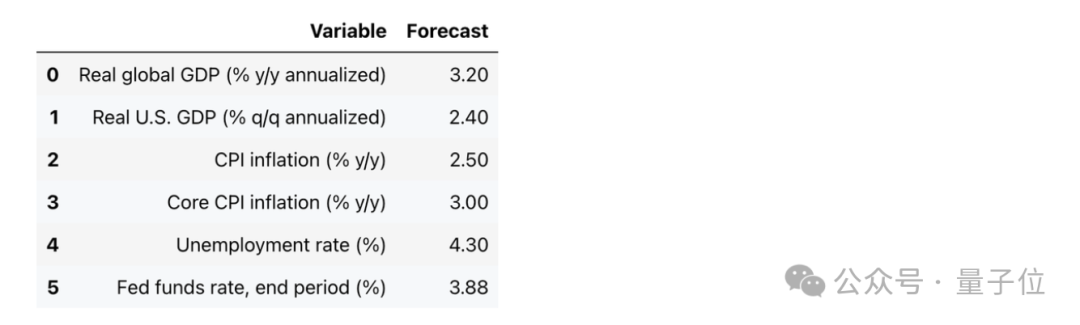
df_docling_forecasts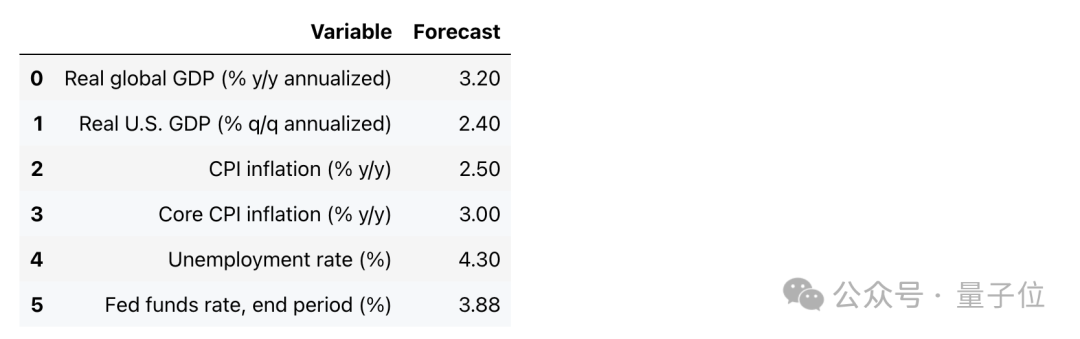
MarkItDown和Docling的结果完全相同,与文档中的真实值准确匹配。
这表明,尽管从人类阅读的角度来看,MarkItDown的输出看起来不太易读,但在此特定情况下,两种方法都使LLM以相同的准确性成功提取经济预测数据。
现在,让我们关注资产类别权重。
我们将从文档中提取资产类别权重,并比较MarkItDown和Docling的结果。
目前信息呈现的结构相当不同。CIO的观点信息以“underweight”开始,经过“neutral”,达到“overweight”。
实际信息在图表中以一些彩色点标出。让我们看看我们是否可以从文档中提取这些信息。
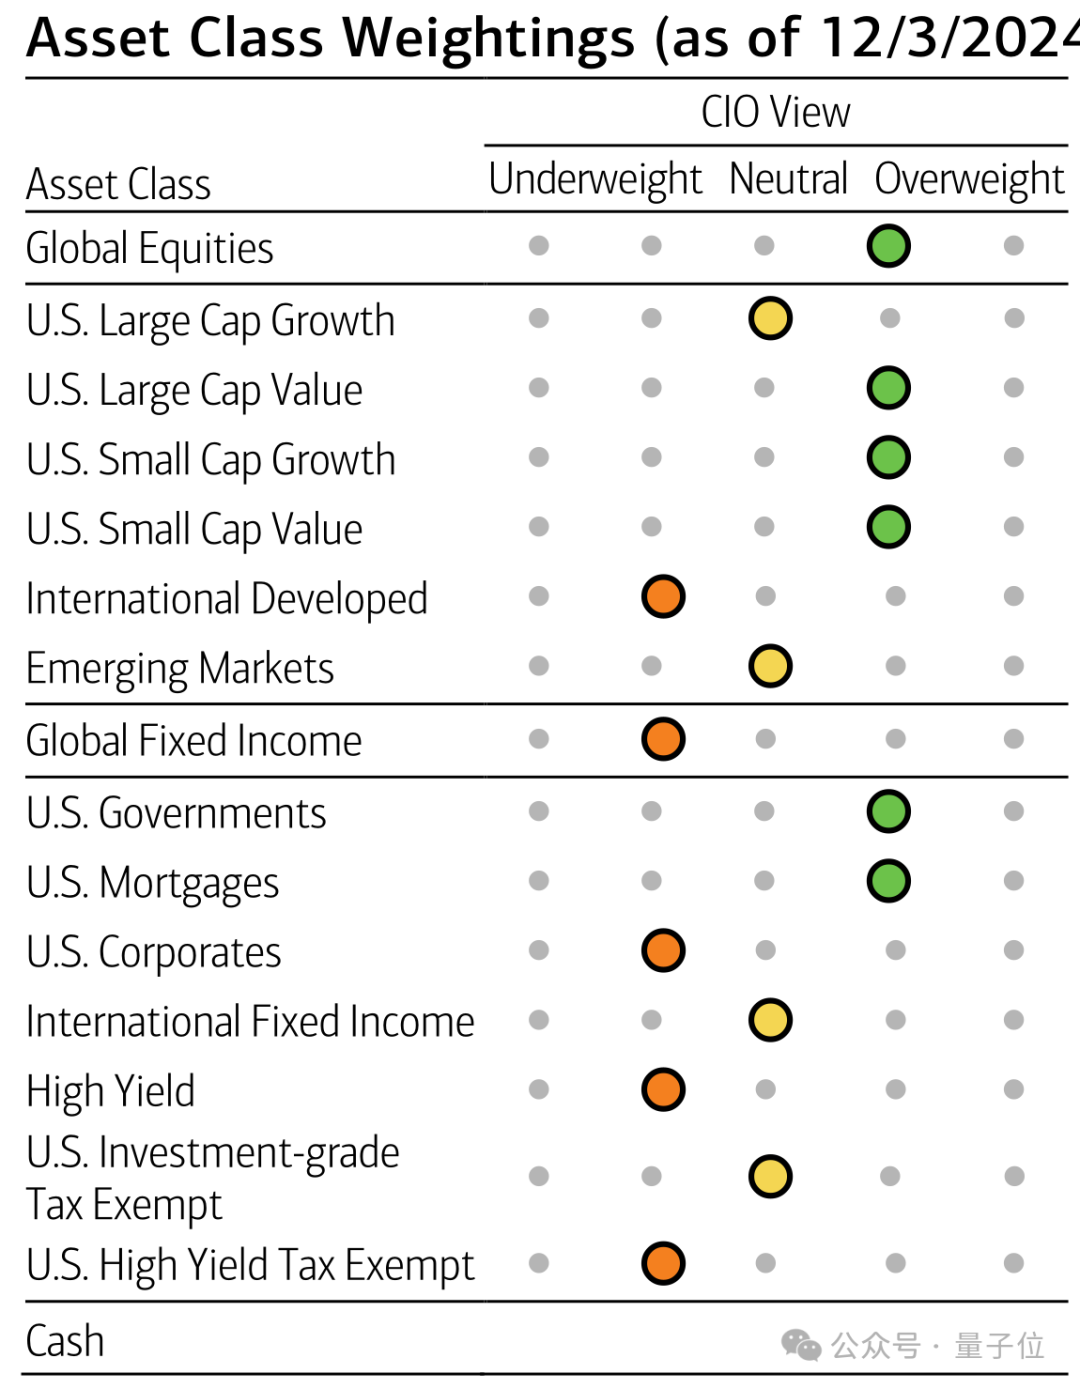
用户只需定义以下数据以提取:“截至2024年12月3日的资产类别权重(-2至2的刻度)”。
这样,我们预计“underweight”将映射为-2,“neutral”映射为0,“overweight”映射为2,之间还有一些数值。
extract_prompt = "Asset Class Weightings (as of 12/3/2024) in a scale from -2 to 2"asset_class_docling = extract_from_doc(extract_prompt, forecast_result_docling, client)asset_class_md = extract_from_doc(extract_prompt, forecast_result_md, client)
df_md = pd.DataFrame([(f.financial_variable, f.financial_forecast) for f in asset_class_md.forecasts],columns=['Variable', 'Forecast'])df_docling = pd.DataFrame([(f.financial_variable, f.financial_forecast) for f in asset_class_docling.forecasts],columns=['Variable', 'Forecast'])
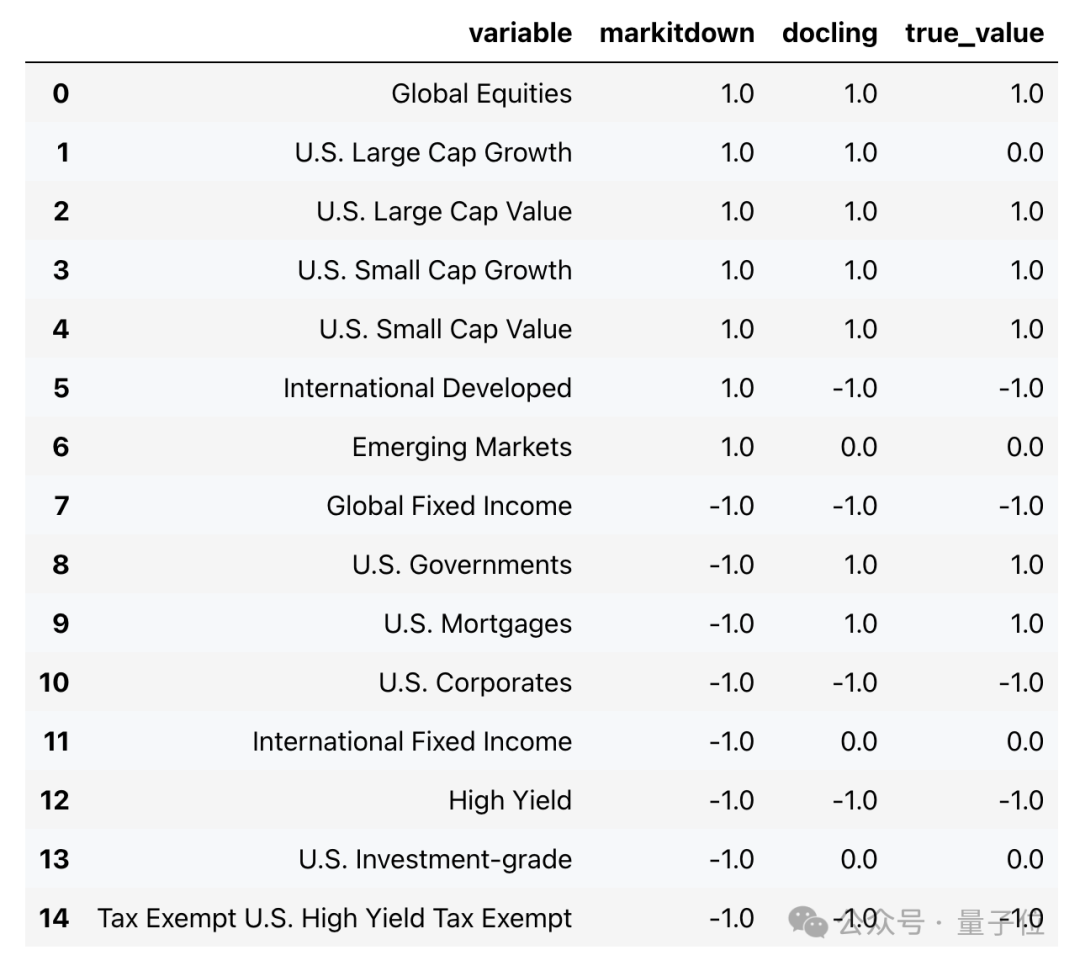
现在我们构建一个DataFrame来比较MarkItDown和Docling的结果,并添加一个包含从文档中手动提取的真实值的“true_value”列。
# Create DataFrame with specified columnsdf_comparison = pd.DataFrame({'variable': df_docling['Variable'].iloc[:-1],'markitdown': df_md['Forecast'],'docling': df_docling['Forecast'].iloc[:-1], # Drop last row'true_value': [1.0, 0.0, 1.0, 1.0, 1.0, -1.0, 0.0, -1.0, 1.0, 1.0, -1.0, 0.0, -1.0, 0.0, -1.0]})display(df_comparison)
然后我们计算出Docling和MarkItDown的准确率:
# Calculate accuracy for markitdown and doclingmarkitdown_accuracy = (df_comparison['markitdown'] == df_comparison['true_value']).mean()docling_accuracy = (df_comparison['docling'] == df_comparison['true_value']).mean()print(f"Markitdown accuracy: {markitdown_accuracy:.2%}")print(f"Docling accuracy: {docling_accuracy:.2%}")
Markitdown accuracy: 53.33%Docling accuracy: 93.33%
Docling的准确率达到了93.33%,仅缺失一个值。MarkItDown的准确率为53.33%,在细微的资产类别权重表现较差。
在这种情况下,LLM从Docling的结构化解析的输出确实比从MarkItDown的无结构化输出中提取了更精确的信息。
更稳健的分析将需要在大量样本数据上运行多次数据提取以估计错误率。
如果我们想系统地从文档中提取所有表格呢?
我们可以通过简单地访问DocumentConverter对象的tables属性来使用 Docling 实现这一点。
import timefrom pathlib import Pathimport pandas as pdfrom docling.document_converter import DocumentConverter
def convert_and_export_tables(file_path: Path) -> list[pd.DataFrame]:"""Convert document and export tables to DataFrames.Args:file_path: Path to input documentReturns:List of pandas DataFrames containing the tables"""doc_converter = DocumentConverter()start_time = time.time()conv_res = doc_converter.convert(file_path)tables = []# Export tablesfor table in conv_res.document.tables:table_df: pd.DataFrame = table.export_to_dataframe()tables.append(table_df)end_time = time.time() - start_timeprint(f"Document converted in {end_time:.2f} seconds.")return tables
# Convert and export tablestables = convert_and_export_tables(Path(FORECAST_FILE_PATH))
我们观察到Docling从文档中提取了7个表格。按照文档中出现的顺序,从上到下、从左到右导出表格。
len(tables)7下面,我们可以看到成功提取的第一个表格是关于股票预测的,第二个是关于固定收益预测的,以及最后一个包含首席投资官股票行业观点的表格。
display(tables[0])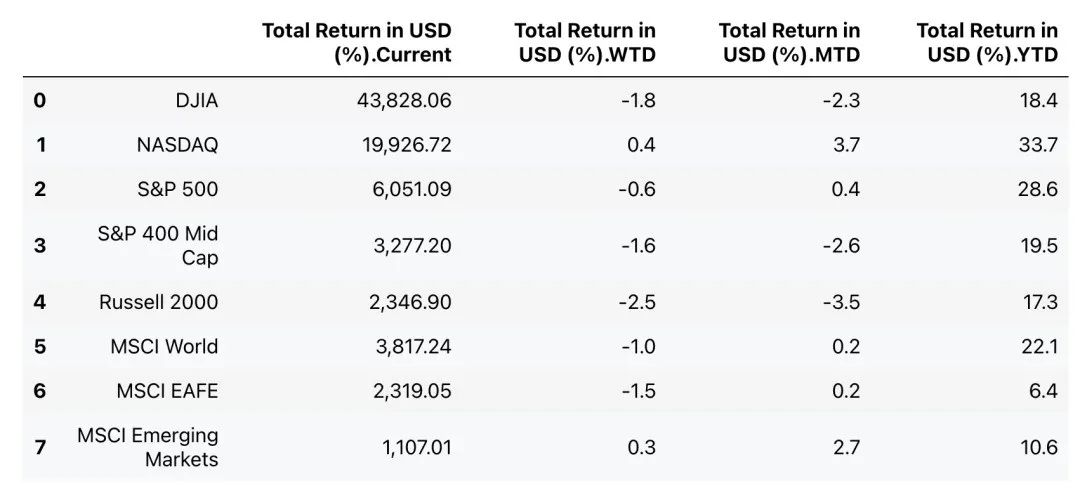
display(tables[1])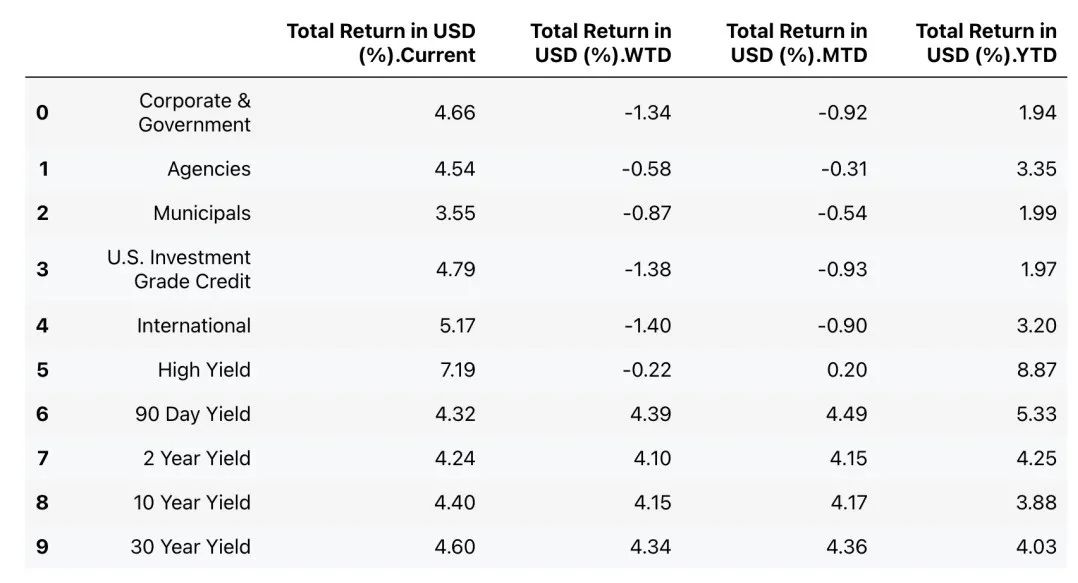
display(tables[6])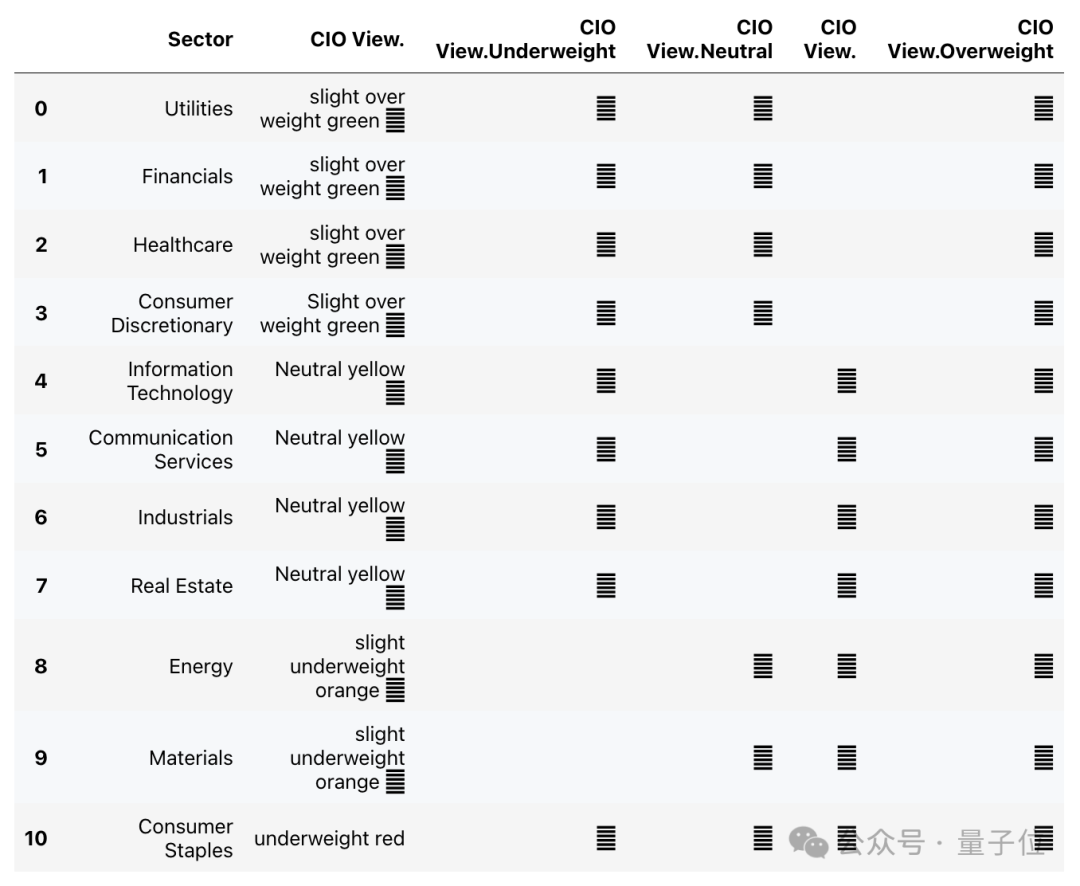
回到MarkItDown,它的一个重要特性是可以集成一个多模态LLM,从图像中提取信息并进行分析与描述。
md_llm = MarkItDown(llm_client=client, llm_model="gpt-4o-mini")result = md_llm.convert("../data/input/forecast.png")以下是我们从输入文档的图像中获取的描述。
display(Markdown(result.text_content))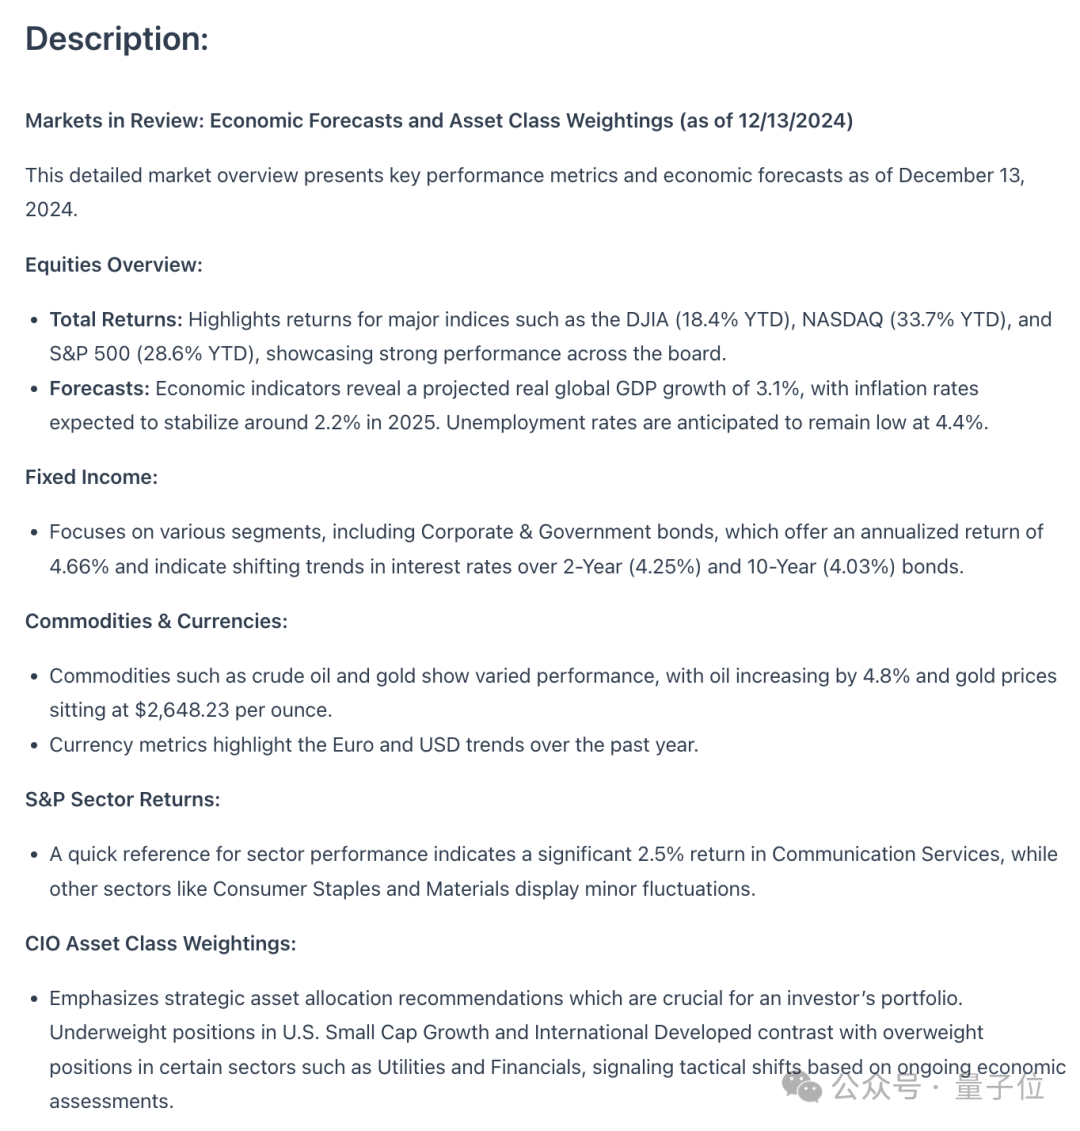
总体而言,该描述在某种程度上是准确的,但包含了一些不准确之处,包括:
关于板块权重,描述中提到“在美国小盘成长股方面存在低配头寸”,但从资产类别权重图表来看,美国小盘成长股实际上显示为超配头寸(绿色圆圈)。
描述中提到“在公用事业和金融等某些板块存在超配头寸”,但从首席投资官股票板块观点来看,这两个板块都显示为中立头寸,而非超配头寸。
对于固定收益,描述中提到“10年期(4.03%)”收益率,但图片显示的是30年期收益率为4.03%,而实际上10年期收益率为4.40%。
可以说,描述中的这些不准确之处可能是底层大型语言模型无法处理图像的结果。需要进一步研究来确定是否确实如此。
更多好用的转换库
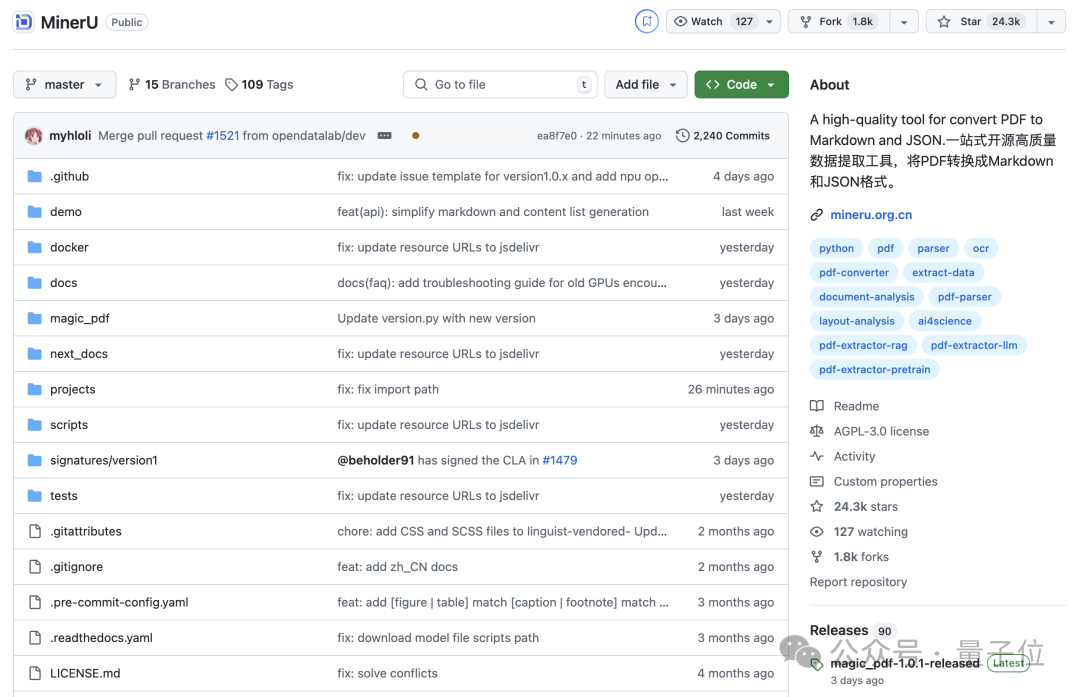
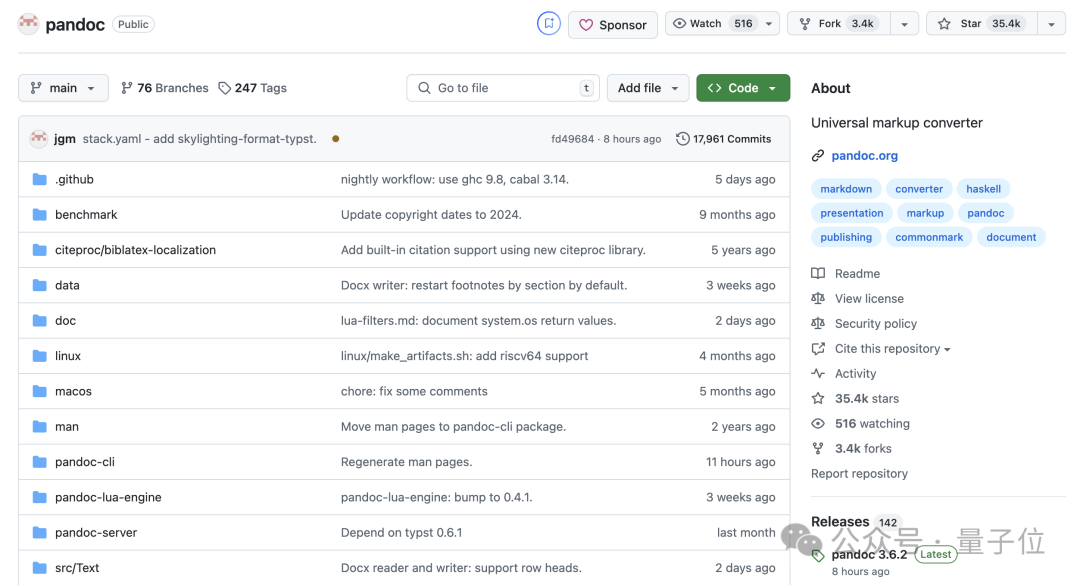
网友们还分享了其他好用的格式转换库,比如MinerU和Pandoc等。
MinerU收藏数超过2.4万,还增加了对json格式的支持。
而Pandoc收藏数超过3.5万,支持的文件类型更广泛,甚至还包括输出epub、ipynb等等。
下次需要将文件转换成LLM容易处理的数据格式的时候,都可以试试哦!
在线版:https://www.getmarkdown.com/
MarkltDown库地址:github.com/microsoft/markitdown
参考链接:
[1]https://www.tamingllms.com/notebooks/input.html#structured-data-extraction
— 完 —
量子位智库年终发布三大年度报告!
带你一起回顾2024年人工智能、智能驾驶、Robotaxi新趋势,预见2025年科技行业新机遇!

2024年度AI十大趋势报告

Robotaxi2024年度格局报告

智能驾驶2024年度报告
一键关注 👇 点亮星标
一键三连「点赞」「转发」「小心心」
欢迎在评论区留下你的想法!
内容中包含的图片若涉及版权问题,请及时与我们联系删除

评论
沙发等你来抢