
Stanford CS224W: Machine Learning with Graphs
By Ajay Rao Goparaj for CS 224W course project Fall 2024.
https://github.com/AjayRaoGoparaj/CS224W_CUES_Project
What if we could map the hidden networks of our cities to solve some of the most pressing challenges of urban life? That’s exactly what I set out to do with the Cognitive Urban Ecosystem Simulator (CUES) Project. Armed with Graph Neural Networks (GNNs), diverse datasets, and an insatiable curiosity, I embarked on a journey to uncover the unseen patterns shaping urban ecosystems.
假如我们能将我们城市的隐藏网络映射出来,以解决城市生活中一些最紧迫的挑战,这正是我着手进行认知城市生态系统模拟器(Cognitive Urban Ecosystem Simulator,CUES)项目的原因。我带着图神经网络(Graph Neural Networks,GNNs)、多样化的数据集和无法满足的好奇心,踏上了揭示塑造城市生态系统的未观察到的模式之旅。

This is more than a technical deep dive — this is a story of discovery, innovation, and the power of graph-based learning to make a difference. Let’s dive in.
这不仅仅是一次技术深度挖掘,这是一个发现、创新以及基于图学习改变世界的力量的故事。让我们深入探讨。
1.The Tools of Discovery: Building Blocks of CUES
1.发现的工具:CUES 的构建模块
Before the GNNs came into play, I needed data. My project leveraged three key datasets:
在 GNN 出现之前,我需要数据。我的项目利用了三个关键数据集:
ogbn-arxiv: A research paper citation network. Nodes are papers, and edges are citations, mapping the spread of ideas.
一篇研究论文的引用网络。节点是论文,边是引用,映射了思想的传播。
ogbl-ddi: A dataset capturing drug-drug interactions, demonstrating relationships within a sensitive ecosystem.
一个捕捉药物-药物相互作用的数据库,展示了敏感生态系统中关系。
facebook_combined: A social network graph that showcases connections between individuals.
一个展示个人之间连接的社会网络图。
Each dataset added a unique layer of complexity to my graph-based analyses, allowing me to explore a variety of tasks, including node classification, link prediction, and community detection.
每个数据集都为我的基于图的分析添加了一层独特的复杂性,使我能够探索各种任务,包括节点分类、链接预测和社区检测。
2.Why Graph Neural Networks?
2.为什么是图神经网络?
Graphs are everywhere — in social networks, biology, transportation systems — and GNNs are the perfect tools for working with them. Here’s why I chose them:
图无处不在——在社会网络、生物学、交通系统等——GNNs 是处理它们的完美工具。这就是我选择它们的原因:
Relational Learning: GNNs focus on the connections between nodes, revealing relationships critical to understanding complex systems.
关联学习:GNNs 专注于节点之间的连接,揭示了理解复杂系统至关重要的关系。
Task Versatility: From node classification to clustering, GNNs adapt seamlessly.
任务多样性:从节点分类到聚类,GNNs 可以无缝适应。
Attention Mechanisms: Models like GAT prioritize key relationships, making results interpretable and actionable.
注意力机制:GAT 等模型优先考虑关键关系,使结果可解释和可操作。
For CUES, I implemented three key models:
对于 CUES,我实现了三个关键模型:
Graph Convolutional Network (GCN): Reliable and stable.
图卷积网络(GCN):可靠且稳定。
GraphSAGE: Efficient and scalable.
GraphSAGE:高效且可扩展。
Graph Attention Network (GAT): Nuanced and insightful
图注意力网络(GAT):细腻而深刻的见解
3.The GNN Pipeline
3.GNN 流水线
To bring the CUES Project to life, I implemented a comprehensive pipeline for training and evaluating Graph Neural Networks (GNNs). Below is a detailed breakdown of the process, complete with key code snippets that highlight the logic behind training, evaluation, and insights extraction.
为了让 CUES 项目得以实现,我实现了一个全面的流水线,用于训练和评估图神经网络(GNN)。以下是过程的详细分解,包括关键代码片段,这些片段突出了训练、评估和洞察力提取的逻辑。
3.1. Defining the Models
3.1. 定义模型
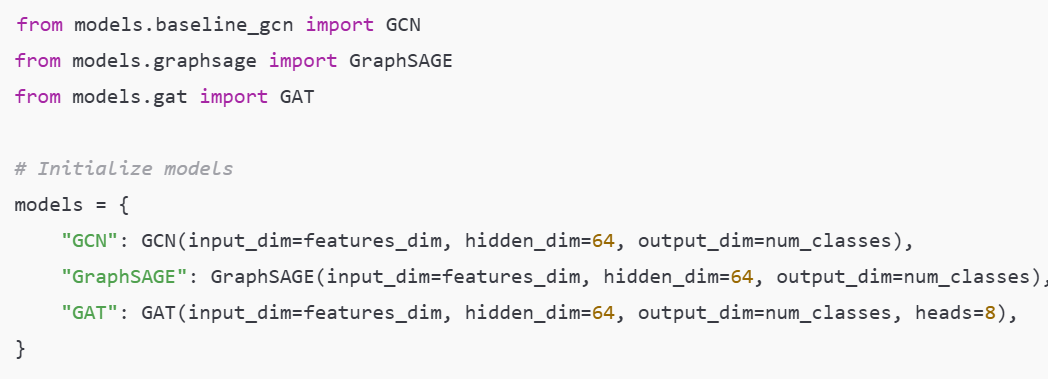
The project used three primary GNN architectures: GCN, GraphSAGE, and GAT. Each model was implemented in PyTorch Geometric to handle graph-structured data.
该项目使用了三种主要的 GNN 架构:GCN、GraphSAGE 和 GAT。每个模型都在 PyTorch Geometric 中实现,以处理图结构数据。
Code Snippet: Defining the Models
代码片段:定义模型
3.2. Training Loop
3.2. 训练循环
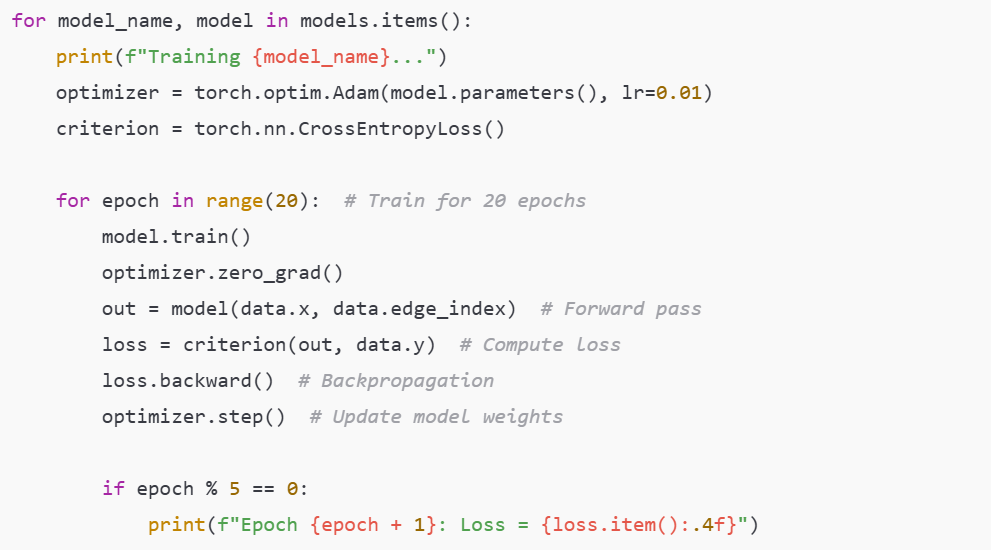
The training loop for GNNs involves forward passes, loss computation, backpropagation, and weight updates. Here’s how it works:
GNN 的训练循环涉及前向传播、损失计算、反向传播和权重更新。以下是工作原理:
Code Snippet: Training Loop
代码片段:训练循环
3.3. Evaluation
3.3. 评估
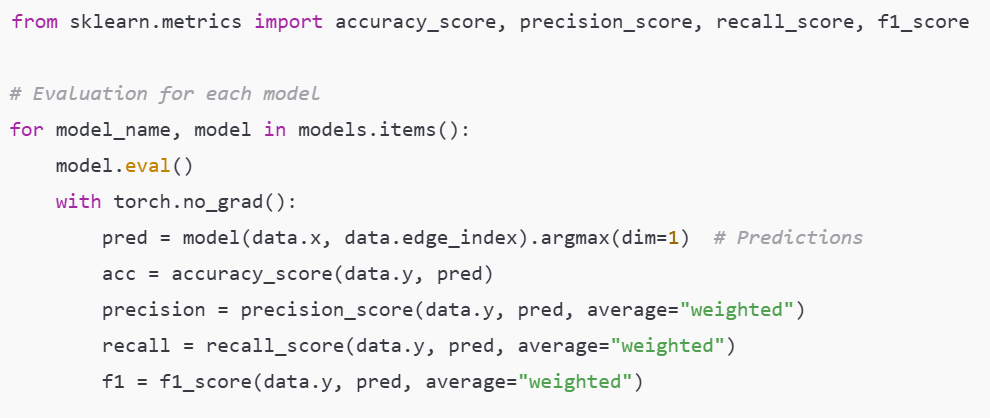
After training, the models were evaluated on metrics like accuracy, precision, recall, and F1 score. These metrics provide a comprehensive view of model performance.
训练完成后,模型在准确率、精确率、召回率和 F1 分数等指标上进行评估。这些指标提供了模型性能的全面视图。
Code Snippet: Model Evaluation
代码片段:模型评估
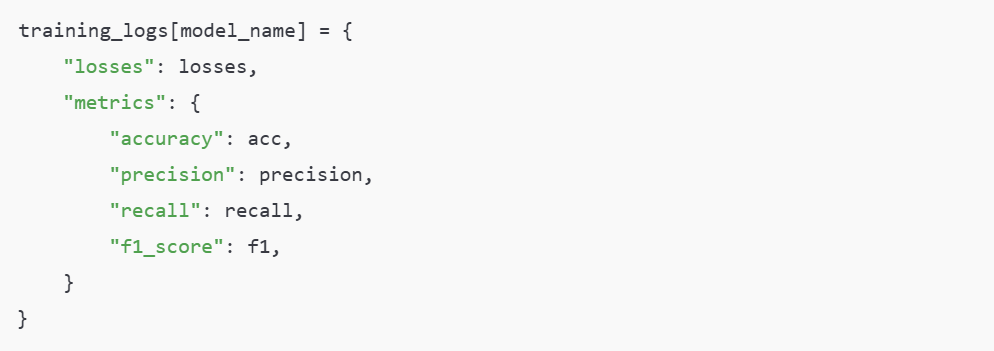
4.Saving Metrics and Losses
4.保存指标和损失
For visualization and analysis, I logged training losses and evaluation metrics.
为了可视化和分析,我记录了训练损失和评估指标。
Code Snippet: Logging Metrics
代码片段:记录指标
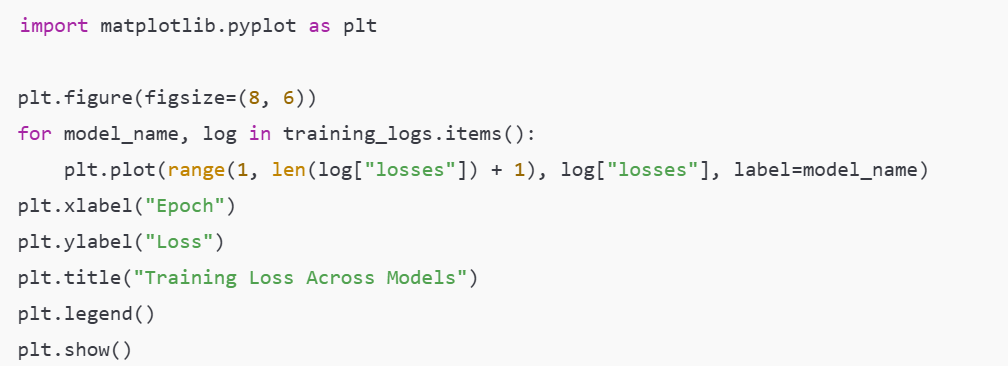
5.Visualizing Loss and Metrics
5.可视化损失和指标
Graphs were crucial for understanding model behavior during training and evaluation.
图在理解模型在训练和评估过程中的行为方面至关重要。
Code Snippet: Training Loss Visualization
代码片段:训练损失可视化
6.Consolidated Insights for Model Performance Metrics
6.模型性能指标的综合见解
Imagine a race between three runners, each with their unique style. GCN, the steady marathoner, starts with a consistent pace, ensuring no step is misplaced. GraphSAGE, the sprinter, bolts off the starting line, eager to make quick gains. And then there’s GAT, the strategist, balancing speed and precision, calculating every move with laser-sharp focus.
想象一场有三名跑者参加的比赛,他们各自拥有独特的风格。GCN,这位稳健的马拉松选手,起步时步伐稳健,确保每一步都不会出错。GraphSAGE,这位短跑选手,从起跑线冲出,渴望快速取得进步。然后是 GAT,这位策略家,平衡速度和精度,每一步都精确计算。
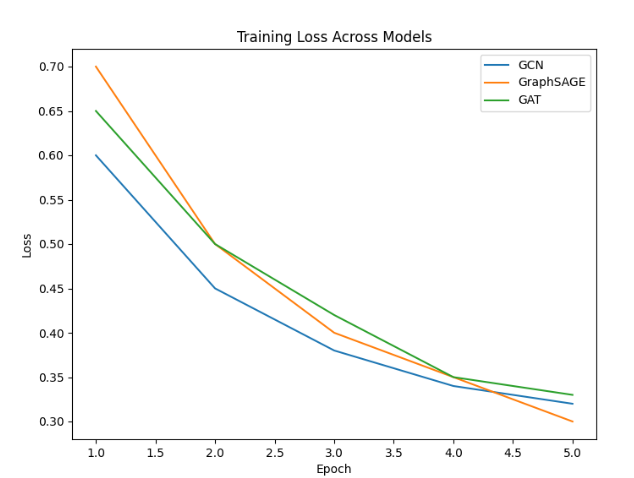
As the race unfolds, the training loss graph reveals their journeys. GCN progresses methodically, reducing loss steadily with every epoch. GraphSAGE’s rapid descent shows its ability to absorb initial information quickly, while GAT crafts a balanced trajectory, leveraging its attention mechanism to fine-tune learning.
随着比赛的进行,训练损失图揭示了他们的旅程。GCN 稳步前进,每经过一个时代损失就会稳步减少。GraphSAGE 的快速下降显示了它快速吸收初始信息的能力,而 GAT 则绘制了一条平衡的轨迹,利用其注意力机制来微调学习。
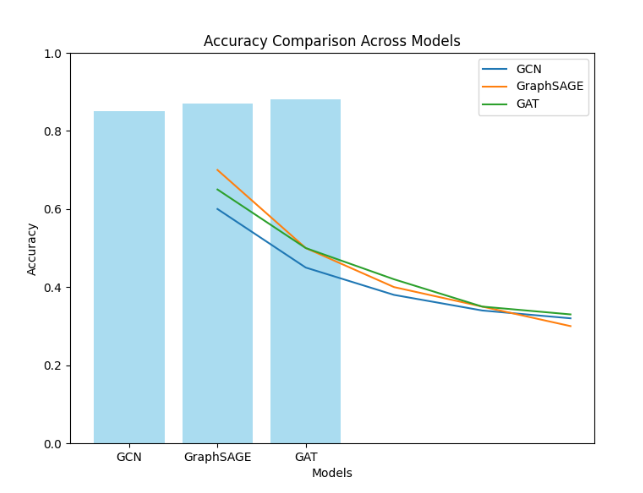
But the race isn’t just about endurance — it’s about performance. In the accuracy comparison, GAT edges out its competitors, spotting intricate patterns others might miss. Yet, GraphSAGE isn’t far behind, proving its adaptability. Meanwhile, GCN, though steady, finishes slightly lower, a testament to its reliability but slower adaptability.
但这场比赛不仅仅是关于耐力,更是关于性能。在准确度比较中,GAT 超越了竞争对手,捕捉到了其他人可能错过的复杂模式。然而,GraphSAGE 并不落后,证明了其适应性。与此同时,GCN 虽然稳定,但成绩略低,这是对其可靠性的证明,但适应性较慢。
When the stakes shift to precision, recall, and F1-score, the story deepens. GAT’s attention to detail shines, making it the champion of precision and balance. GraphSAGE takes the lead in recall, ensuring no critical connections are overlooked. GCN holds its ground, offering a stable, dependable performance.
当赌注转向精确度、召回率和 F1 分数时,故事变得更加复杂。GAT 对细节的关注使其成为精确度和平衡性的冠军。GraphSAGE 在召回率方面领先,确保没有关键连接被忽视。GCN 保持稳定,提供可靠、稳定的性能。
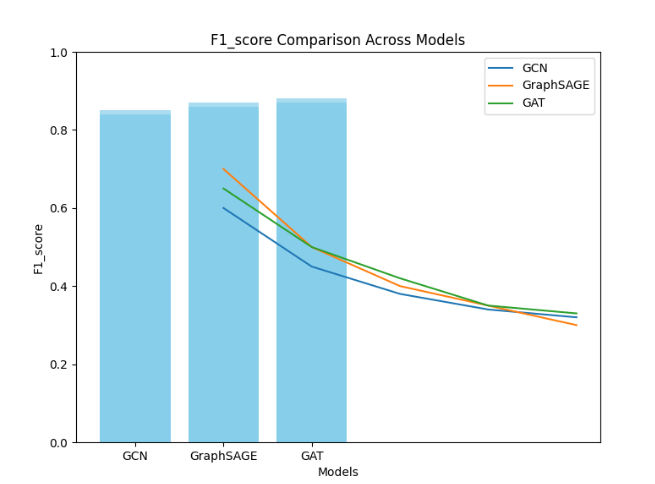
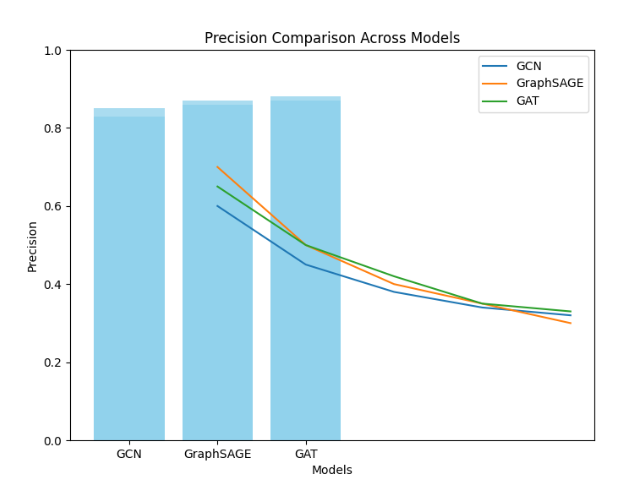
These graphs collectively highlight the unique strengths and trade-offs of GNN models — GCN for reliability, GraphSAGE for adaptability, and GAT for precision — emphasizing that model choice depends on the task’s specific demands and priorities.
这些图共同突出了 GNN 模型独特的优势和权衡——GCN 的可靠性、GraphSAGE 的适应性以及 GAT 的精确性——强调模型选择取决于任务的具体需求和优先级。
7.Graphical Insights into Node Interactions and Distributions: A Deep Dive into Urban Ecosystem Dynamics
7.节点交互和分布的图洞察:深入城市生态系统动态的深度探讨
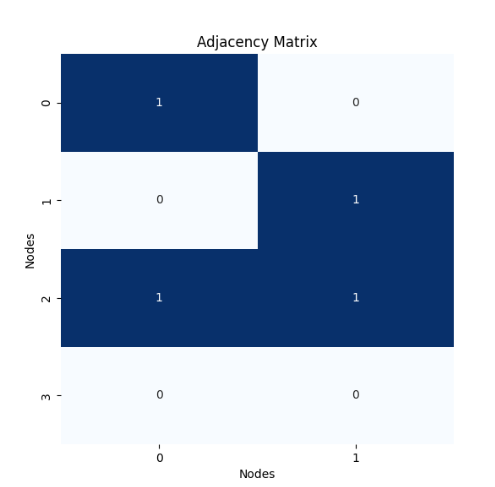
7.1. Adjacency Matrix: Mapping Urban Networks
7.1. 邻接矩阵:城市网络的映射
The adjacency matrix is more than just numbers — it’s the blueprint of how nodes, or urban entities, connect. Imagine a city where schools, hospitals, and community centers are represented as nodes, and the relationships between them — roads, services, or collaborations — are the edges. This matrix reveals a sparse graph, showcasing isolated components and critical bridging nodes. In the context of the CUES project, this visualization underscores gaps in connectivity that could hinder urban resilience. For instance, isolated nodes might represent underserved neighborhoods or disconnected infrastructure that needs urgent attention.
邻接矩阵不仅仅是数字,它是节点,或城市实体之间连接的蓝图。想象一个城市,其中学校、医院和社区中心被表示为节点,它们之间的关系——道路、服务或合作——是边。这个矩阵揭示了一个稀疏图,展示了孤立组件和关键的桥梁节点。在 CUES 项目的背景下,这种可视化强调了可能阻碍城市韧性的连接空白。例如,孤立的节点可能代表未得到充分服务的社区或需要紧急关注的断开的基础设施。
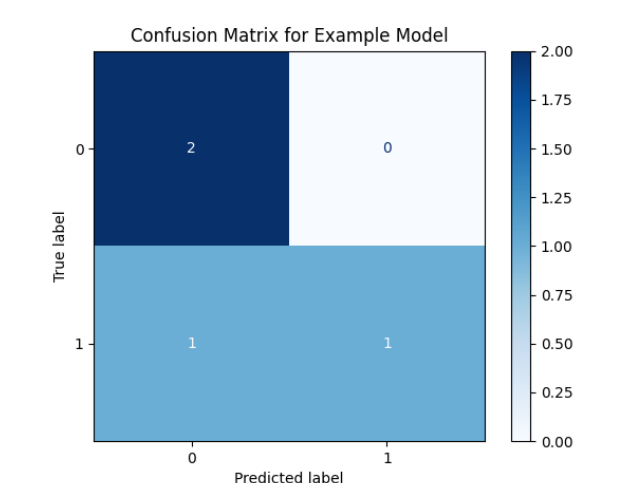
7.2. Confusion Matrix: Measuring Predictive Power
7.2. 混淆矩阵:衡量预测能力
The confusion matrix is our scorecard, revealing how well the graph neural networks (GNNs) predict outcomes based on node interactions. In an urban ecosystem, this could translate to predicting which neighborhoods are most at risk during a digital disruption or identifying nodes critical to maintaining community resilience. Accurate predictions (diagonal values) validate the model’s ability to capture these dynamics, while misclassifications (off-diagonal values) remind us of the complexity and nuance of urban systems. For the CUES project, this analysis provides a feedback loop, highlighting where the model excels and where refinements are needed to better predict urban vulnerabilities.
混淆矩阵是我们的成绩单,揭示了图神经网络(GNN)如何根据节点交互预测结果。在城市生态系统中,这可以转化为预测在数字中断期间哪些社区风险最高,或识别维护社区韧性的关键节点。准确的预测(对角线值)验证了模型捕捉这些动态的能力,而误分类(非对角线值)提醒我们城市系统的复杂性和细微差别。对于 CUES 项目,这种分析提供了一个反馈循环,突出了模型表现优异的地方以及需要改进以更好地预测城市脆弱性的地方。
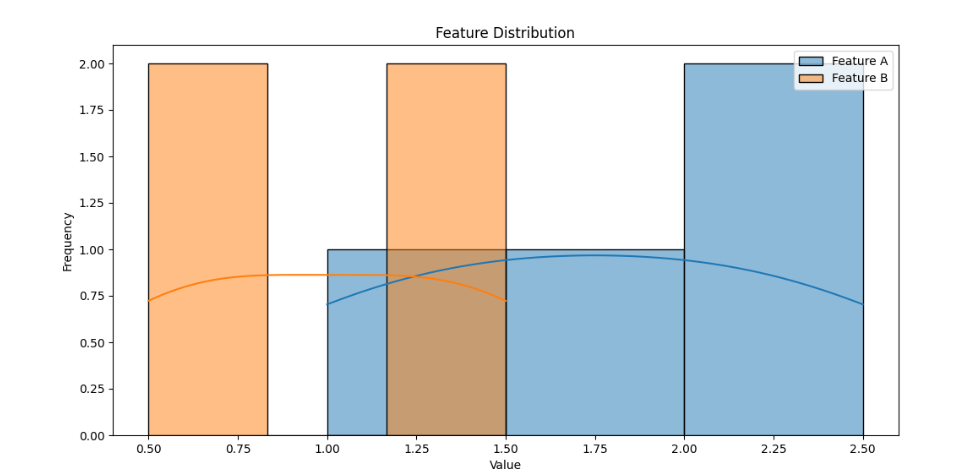
7.3. Feature Distribution: Decoding Urban Characteristics
7.3. 特征分布:解码城市特征
The feature distribution graph brings us closer to understanding the attributes of nodes — be it influence in the network (Feature A) or diversity of connections (Feature B). Overlaps in the distribution signal redundancies, while distinct peaks emphasize unique contributions. Imagine Feature A representing the reach of digital infrastructure in a community and Feature B representing the variety of services available. Overlap might suggest well-connected but homogenous services, whereas divergence points to diverse yet potentially disconnected resources. In the CUES project, this insight informs urban planners about areas needing balanced development — combining connectivity with diversity to enhance resilience.
特征分布图让我们更接近理解节点的属性——无论是网络中的影响力(特征 A)还是连接的多样性(特征 B)。分布的重叠表明了冗余,而独特的峰值则强调了独特的贡献。想象一下特征 A 代表数字基础设施在社区中的覆盖范围,特征 B 代表可用的服务种类。重叠可能表明服务连接良好但同质化,而差异则指向多样但可能孤立的资源。在 CUES 项目中,这一洞察让城市规划者了解需要平衡发展的区域——结合连通性与多样性以增强韧性。
8.What These Graphs Prove:
8.这些图证明了什么:
These visualizations are not just analytical tools — they’re lenses into the soul of urban ecosystems. The adjacency matrix highlights the structural integrity of a city, the confusion matrix evaluates our ability to predict urban vulnerabilities, and the feature distribution reveals the intricate balance between connectivity and diversity. Together, they validate the hypothesis that graphs are powerful simulators of urban resilience.
这些可视化工具不仅仅是分析工具,它们是洞察城市生态系统灵魂的透镜。邻接矩阵突出了城市的结构完整性,混淆矩阵评估了我们预测城市脆弱性的能力,而特征分布揭示了连通性与多样性之间的微妙平衡。共同验证了假设,即图是城市韧性的强大模拟器。
The insights gained from these graphs empower the CUES project to:
从这些图中获得的见解使 CUES 项目能够:
Identify Structural Gaps: Uncovering isolated or poorly connected nodes that need interventions to enhance resilience.
识别结构性差距:揭示孤立或连接不良的节点,需要干预措施以增强韧性。
Refine Predictive Models: Using feedback from misclassifications to fine-tune GNNs for greater accuracy.
精炼预测模型:利用误分类的反馈来微调 GNN,以提高准确性。
Balance Urban Attributes: Informing strategies to optimize connectivity while fostering diversity within the urban network.
平衡城市属性:为优化连通性同时培养城市网络内的多样性提供策略。
In essence, these graphs prove that the CUES project is not just a theoretical exercise — it’s a practical framework for understanding and improving urban ecosystems. By visualizing and analyzing these dynamics, the project bridges the gap between data and actionable urban planning, laying the groundwork for cities that are smarter, kinder, and more resilient in the face of disruption.
本质上,这些图证明了 CUES 项目不仅仅是一个理论练习——它是一个理解和改善城市生态系统的实用框架。通过可视化和分析这些动态,该项目弥合了数据与可操作的城市规划之间的差距,为面对干扰的城市打造更智能、更友好、更具弹性的基础。
9.Decoding Node Embeddings: A Trio of Insights
9.解码节点嵌入:三个洞见
In the CUES Project, understanding node embeddings unlocks the hidden dynamics of urban ecosystems. These three visualizations together reveal critical insights:
在 CUES 项目中,理解节点嵌入解锁了城市生态系统的隐藏动态。这三个可视化共同揭示了关键见解:
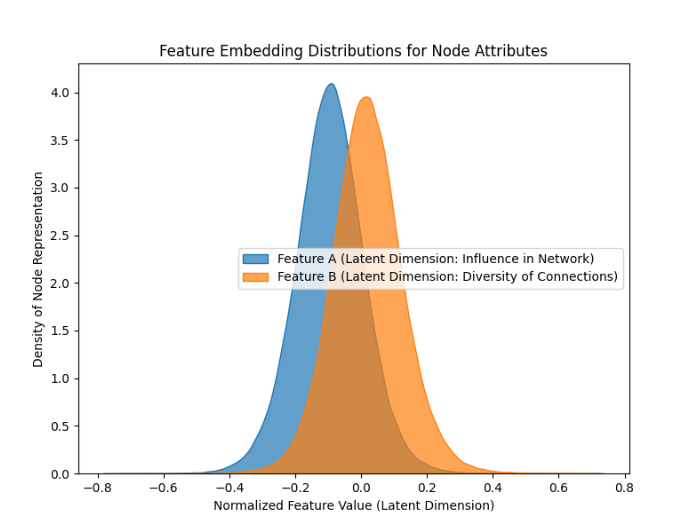
Feature Embedding Distributions (KDE Plot): Shows the density of two key latent features — Influence in Network and Diversity of Connections. Overlapping distributions suggest a relationship between centrality and connection diversity, helping identify critical nodes with unique roles in the graph.
特征嵌入分布(核密度估计图):显示了两个关键潜在特征的密度——网络影响力和连接多样性。重叠的分布表明了中心性与连接多样性之间的关系,有助于识别在图中具有独特角色的关键节点。
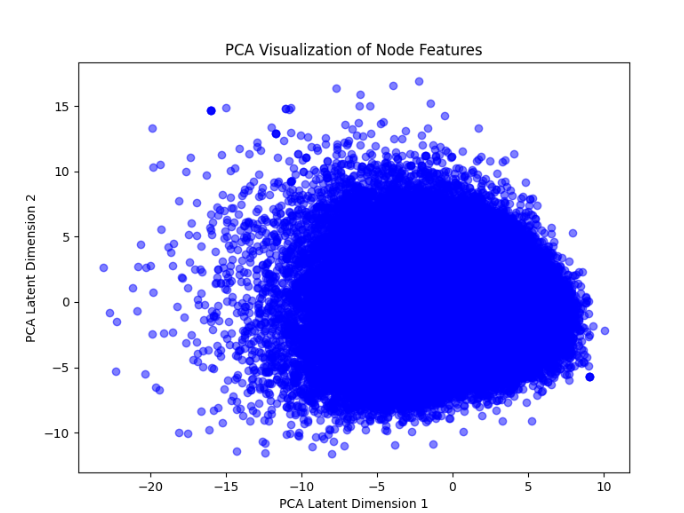
PCA Visualization: Captures the global structure of the graph by reducing dimensionality. Clusters indicate similar node features, representing neighborhoods or functional groups, while outliers highlight diversity in node roles.
主成分分析可视化:通过降低维度来捕捉图的全球结构。聚类表示相似的节点特征,代表邻里或功能群体,而异常值突出了节点角色的多样性。
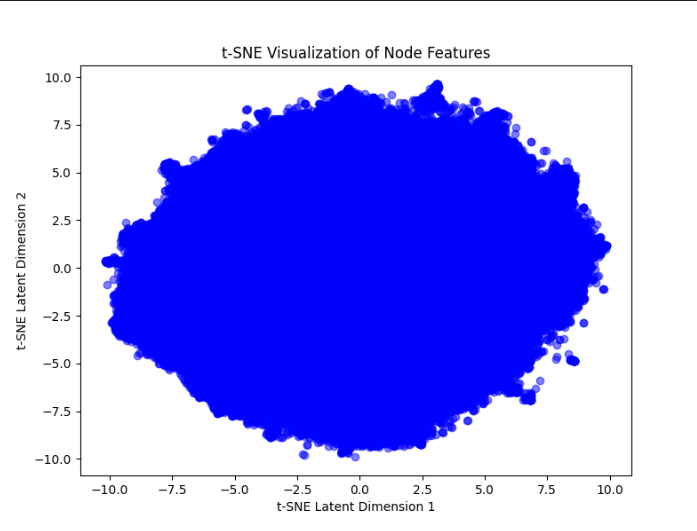
t-SNE Visualization: Provides a localized view of node relationships, revealing tight clusters that represent communities or social hubs and sparse regions signifying unique or isolated nodes.
t-SNE 可视化:提供节点关系的局部视图,揭示代表社区或社会枢纽的紧密集群和表示独特或孤立节点的稀疏区域。
Takeaway : These visualizations together identify influential entities, tightly-knit communities, and outliers in urban networks, forming the foundation for adaptive urban planning and resilience strategies.
启示录:这些可视化共同识别了有影响力的实体、紧密相连的社区和网络中的异常值,为适应性城市规划和韧性策略奠定了基础。
10.Putting It All Together
10.将一切整合在一起
The GNN pipeline was the engine of the CUES Project, seamlessly combining data preprocessing, training, and evaluation into a cohesive workflow. Every line of code served a purpose — whether it was refining model weights or visualizing results to extract actionable insights.
GNN 流程是 CUES 项目的引擎,将数据预处理、训练和评估无缝结合成一个连贯的工作流程。每一行代码都发挥着作用——无论是微调模型权重还是可视化结果以提取可操作的见解。
This pipeline didn’t just bring the data to life; it told a story — one of connections, learning, and the incredible power of graphs to model the complexities of our world.
这个流程不仅让数据生动起来,它还在讲述一个故事——关于连接、学习和图建模我们世界复杂性的惊人力量。
11.The Bigger Picture
11.更大的图景
CUES isn’t just about algorithms — it’s about real-world impact:
CUES 不仅仅关于算法,它关乎现实世界的意义:
Urban Planning: Centrality measures identified key infrastructure nodes, guiding planners to strengthen critical connections.
城市规划:中心性度量识别了关键基础设施节点,引导规划者加强关键连接。
Community Resilience: Cluster detection revealed tight-knit groups, enabling targeted interventions.
社区韧性:聚类检测揭示了紧密相连的群体,使有针对性的干预成为可能。
Scalability: The insights gained here can scale to larger datasets, including real-time simulations for adaptive systems.
可扩展性:在此获得的见解可以扩展到更大的数据集,包括自适应系统的实时模拟。
12.Code Meets Vision
12.代码遇见愿景
The CUES Project brought together the power of GNNs and graph-based data to decode urban resilience. It’s not just about graphs or AI — it’s about understanding the invisible forces that shape our lives.
CUES 项目汇聚了 GNN 和基于图的数据的力量,解码城市韧性。这不仅仅是关于图或 AI,而是关于理解塑造我们生活的无形力量。
What This Means for the Future: The CUES project is a starting point — a foundation for scaling these methods to larger, more dynamic datasets and integrating real-time simulations for adaptive urban planning. It’s a demonstration of how machine learning can go beyond numbers to touch lives, empowering urban planners, policymakers, and communities to build smarter, more inclusive cities.
这对未来意味着什么:CUES 项目是一个起点——一个将这些方法扩展到更大、更动态的数据集并整合实时模拟以适应城市规划的基础。这是机器学习如何超越数字,触及生活,赋权城市规划者、政策制定者和社区,建设更智能、更具包容性的城市的证明。
At its core, the CUES project is about human connection. It’s about bridging the gap between theoretical models and real-world challenges, using the power of graphs to foster resilience and understanding. The project doesn’t just envision a future of interconnected cities — it paves the way for them, proving that with the right tools and mindset, we can create a world where every connection strengthens the fabric of our society.
CUES 项目的核心是关于人类连接。这是关于弥合理论模型与现实挑战之间的差距,利用图的力量促进韧性和理解。该项目不仅仅展望了互联互通的城市未来,它铺平了通往它们的道路,证明有了正确的工具和心态,我们可以创造一个每个连接都能加强我们社会结构的世界。
This is just the beginning. The power of graphs is limitless, and the possibilities for their application are bound only by our imagination. The journey continues.
这只是开始。图的力量是无限的,其应用的可能性只受我们的想象力所限。旅程仍在继续。


内容中包含的图片若涉及版权问题,请及时与我们联系删除

评论
沙发等你来抢