
Stanford CS224W: Machine Learning with Graphs
By Noah Cowan, Will Shabecoff, and Kushagra Gupta as part of the Stanford CS 224W Final Project

Our team getting ready to generate the next best dish
我们的团队正在准备制作下一道最佳菜肴
https://colab.research.google.com/drive/1R-EbuFYipbG1BrlxOyYxhveMM8JvRh3Z?usp=sharing
Graph neural networks (GNNs) have become a popular approach for modeling graph-structured data in recent years, with applications in various fields, including social networks, biology, and recommendation systems. In this blog post, we’ll explore how we can use GNNs to predict new edges between ingredients in a food network, based on their flavor profiles.
近年来,图神经网络(GNNs)已成为建模图结构数据的流行方法,应用领域包括社交网络、生物学和推荐系统。在这篇博客文章中,我们将探讨如何利用 GNNs 根据食材的风味特征,预测食品网络中食材之间的新边。
The idea of using flavor profiles to model food ingredients is not new. Food scientists have long used flavor descriptors such as sweet, bitter, and umami to characterize the taste of different ingredients and products. In recent years, this information has been used to create flavorgraphs, which visualize the flavor characteristics of different ingredients and products in a graph-like structure.
使用风味特征来建模食品食材的想法并非新事物。食品科学家长期以来一直使用甜、苦、鲜等风味描述符来描述不同食材和产品的味道。近年来,这些信息被用于创建风味图谱,它以图结构的形式可视化了不同食材和产品的风味特征。
By treating the flavorgraph as a network and using GNNs, we can leverage the rich flavor information to predict new edges between ingredients, indicating potential flavor pairings or substitutions. This approach can have practical applications in food product development, recipe recommendation, and menu planning, among others.
将风味图谱视为网络并使用 GNNs,我们可以利用丰富的风味信息来预测食材之间新的边,表明潜在的口味搭配或替代。这种方法在食品产品开发、食谱推荐和菜单规划等方面具有实际应用。
In this blog post, we’ll go through the steps of building a GNN-based model for predicting new edges between ingredients in a flavorgraph. We’ll start by exploring the flavorgraph dataset and preprocessing it for GNN training. Then, we’ll build and train the GNN model using PyTorch Geometric, a popular library for GNNs in PyTorch. Finally, we’ll evaluate the performance of our model and discuss potential future directions for this research.
在这个博客文章中,我们将逐步介绍如何构建一个基于 GNN 的模型,用于预测风味图谱中原料之间的新边。我们将从探索风味图谱数据集并对其进行预处理以进行 GNN 训练开始。然后,我们将使用 PyTorch Geometric(一个流行的 PyTorch GNN 库)来构建和训练 GNN 模型。最后,我们将评估我们的模型性能,并讨论这项研究的潜在未来方向。
Problem Statement (What’s Cooking?)
问题陈述(在做什么菜?)
We want to discover new recipes that no chef ever dreamt of! Creating novel and reasonable subgraphs between ingredients is the main objective of this task. The creation of new recipes has numerous benefits such as providing diversity to the dining table, exploring and appreciating different cuisines, cultures, and traditions, introducing healthier ingredients and cooking methods, and providing personal satisfaction and fulfillment by sharing new recipes with others.
我们想要发现从未有厨师梦想过的全新食谱!在食材之间创建新颖且合理的子图是这个任务的主要目标。创造新食谱有许多好处,例如为餐桌提供多样性,探索和欣赏不同的菜系、文化和传统,引入更健康的食材和烹饪方法,以及通过与他人分享新食谱来获得个人满足感和成就感。
Link prediction is the key task here, as it helps us to identify new and interesting ingredient pairings by finding new links between ingredient nodes. Our FlavorGraph database contains food compound information that can help us to create compelling flavor combinations that may not have been explored before due to various reasons such as cultural differences. We use link prediction for two separate problems: choosing a specific ingredient and constructing a recipe iteratively by using the most likely next edge. With this approach, it becomes easier to build a recipe step by step and stop when the edge likelihood is not high enough. We are excited to see the fresh and innovative food pairings discovered by link prediction using graph neural networks.
链接预测是这里的重点任务,因为它能通过在食材节点间发现新链接,帮助我们识别新的有趣食材搭配。我们的 FlavorGraph 数据库包含食品化合物信息,能帮助我们创造出引人入胜的口味组合,这些组合可能由于文化差异等原因此前未被探索过。我们使用链接预测解决两个独立问题:选择特定食材,以及通过使用最可能的下一个边来迭代构建食谱。采用这种方法,逐步构建食谱变得更加容易,当边的可能性不够高时即可停止。我们很期待看到图神经网络通过链接预测发现的新颖创新食材搭配。
Dataset (Basically whatever’s left in the fridge):
数据集(基本上是冰箱里剩下的东西):
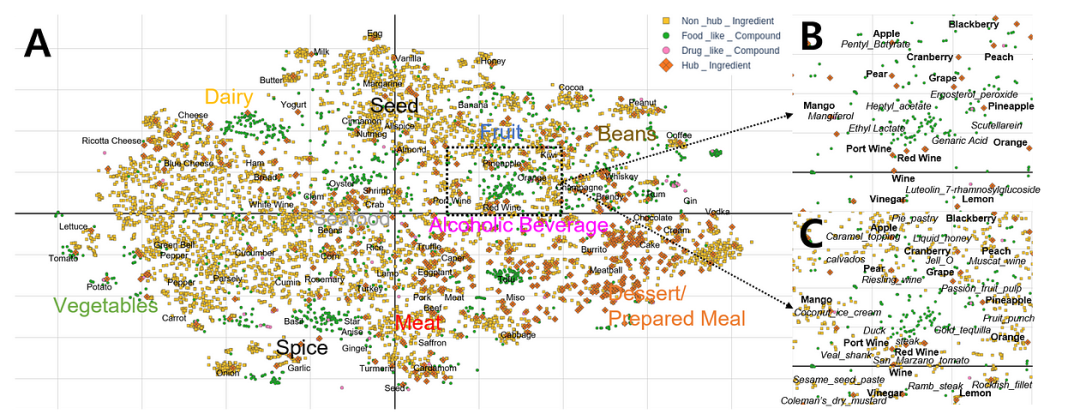
FlavorGraph Embeddings 风味图谱嵌入
We use the FlavorGraph[1] dataset for our task. The FlavorGraph dataset is a graph-based dataset that captures the flavor characteristics of various food ingredients. It consists of a graph where nodes represent different ingredients, and edges represent flavor similarities between them. The graph is constructed based on the co-occurrence of flavor compounds in different ingredients, and the edges are weighted based on the cosine similarity between the flavor compound vectors of the ingredients. The dataset contains 1,027 ingredients and 28,186 edges, and the flavor compounds were extracted from the Flavornet database. The FlavorGraph dataset has been used in various research works to explore the relationships between different ingredients and predict new flavor pairings or substitutions.
我们使用 FlavorGraph[1]数据集来执行我们的任务。FlavorGraph 数据集是一个基于图的数据集,它捕捉了各种食品原料的风味特征。该数据集由一个图构成,其中节点代表不同的原料,边代表它们之间的风味相似性。这个图是基于不同原料中风味化合物的共现性构建的,边的权重基于原料的风味化合物向量的余弦相似性计算得出。该数据集包含 1,027 种原料和 28,186 条边,风味化合物是从 Flavornet 数据库中提取的。FlavorGraph 数据集已被用于多项研究工作,以探索不同原料之间的关系,并预测新的风味搭配或替代方案。
Preprocessing (Cutting and Chopping)
预处理(切割和切碎)
FlavorGraph contains nodes corresponding to both food ingredients and chemical compounds. For our project, we restrict ourselves to food ingredient nodes. This allows us to work with a homogenous graph, as all the nodes and edges are of a similar type. One advantage of using a homogeneous graph for link prediction is that it is simpler to model, and the GNNs designed for such graphs are often computationally efficient. We load in the dataset for nodes and edges, and restrict the nodes to ingredients observed in edges. This results in 6,653 ingredient nodes, with 111,355 edges between them.
FlavorGraph (https://www.nature.com/articles/s41598-020-79422-8)包含对应于食品原料和化学化合物的节点。在我们的项目中,我们仅限于食品原料节点。这使得我们可以处理一个同构的图,因为所有节点和边都是相同类型的。使用同构图进行链接预测的一个优点是建模更简单,为这种图设计的 GNN 通常计算效率较高。我们加载了节点和边的数据集,并将节点限制为在边中观察到的原料。这导致有 6,653 个原料节点,它们之间有 111,355 条边。
edge_url="https://raw.githubusercontent.com/lamypark/FlavorGraph/master/input/edges_191120.csv"
edges_df=pd.read_csv(edge_url)
print(edges_df.edge_type.value_counts())
##########################################
edges_df = edges_df.iloc[:111355,:]
##########################################
edges_df.head()
Next, we create an `edge_index` using only the nodes that have edges to other ingredient nodes (i.e. removing nodes which only have edges to food compounds). It’s worth noting that the edge weights in FlavorGraph are not derived from explicit taste tests or sensory evaluations of food, but rather from the chemical composition of the ingredients. The chemical fingerprints are obtained by representing each ingredient as a vector of molecular descriptors, which are quantitative properties that describe the chemical and physical characteristics of the molecule. The cosine similarity between two ingredient vectors is then computed, which measures the similarity between the two molecules based on their chemical fingerprints.
接下来,我们使用仅与其他食材节点有边连接的节点(即移除仅与食品化合物有边的节点)来创建一个 `edge_index`。值得注意的是,FlavorGraph 中的边权重并非来自明确的味觉测试或食品感官评估,而是来自食材的化学成分。化学指纹是通过将每种食材表示为分子描述符的向量获得的,这些描述符是描述分子化学和物理特性的定量属性。然后计算两个食材向量之间的余弦相似度,该相似度基于化学指纹测量两个分子之间的相似性。
Our objective is to partition links or edges into training, validation, and testing data sets in a random manner. To accomplish this, we may utilize the `RandomLinkSplit` module available in PyG.
我们的目标是以随机方式将链接或边划分为训练、验证和测试数据集。为此,我们可以使用 PyG 中可用的 `RandomLinkSplit` 模块。
transform = RandomLinkSplit(is_undirected=True,
      add_negative_train_samples=False,
      disjoint_train_ratio=0.35)
train_data, val_data,test_data = transform(flavorGraph)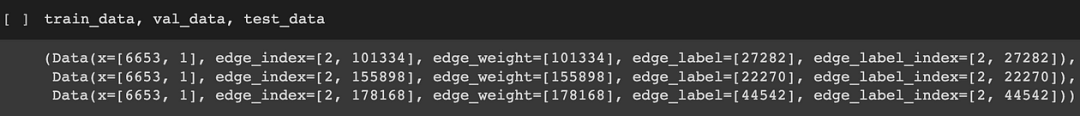
There are several things to note about this output data.
关于此输出数据有几个需要注意的事项。
Initially, we split edge_index into training, validation, and test splits, ensuring that the validation and test splits do not include any edges from their respective splits (i.e., only the training split contains edges). This is done to prevent any target leakage in node embeddings when making predictions on validation and test data, as edge_index (and x) is utilized for the encoder’s node embedding creation.
最初,我们将 edge_index 划分为训练集、验证集和测试集,确保验证集和测试集中的边不包含各自集的边(即只有训练集包含边)。这是为了在验证和测试数据预测时防止节点嵌入中的目标泄露,因为 edge_index(和 x)用于编码器节点嵌入的创建。
Next, two new attributes, namely edge_label and edge_label_index, are appended to each split data. These attributes represent the edge labels and indices related to each split, respectively. The edge_label_index is employed by the decoder to generate predictions, while the edge_label is utilized for model evaluation.
接下来,我们向每个分割数据追加两个新属性,即 edge_label 和 edge_label_index。这些属性分别表示与每个分割相关的边标签和索引。edge_label_index 由解码器用于生成预测,而 edge_label 用于模型评估。
Thirdly, negative links are introduced into both val_data and test_data, with the same number as positive links (neg_sampling_ratio=1.0). The negative links are added to the edge_label and edge_label_index attributes but not included in edge_index as we do not want to utilize negative links during the encoder’s node embedding creation. Moreover, we do not add negative links to the training set here (by setting add_negative_train_samples=False) as they are added during the training loop in train_link_predictor. This randomization during training aims to enhance the model’s robustness.
第三,我们将负边引入到 val_data 和 test_data 中,数量与正边相同(neg_sampling_ratio=1.0)。负边被添加到 edge_label 和 edge_label_index 属性中,但不会包含在 edge_index 中,因为我们不想在编码器创建节点嵌入时使用负边。此外,我们在这里不会将负边添加到训练集中(通过设置 add_negative_train_samples=False),因为它们会在 train_link_predictor 的训练循环中添加。这种训练期间的随机化旨在增强模型的鲁棒性。
PyG Link Prediction (Our Masterchef)
PyG 链接预测(我们的主厨)
PyG utilizes autoencoder decoders to perform link prediction[2]. In PyG, the autoencoder is a graph neural network (GNN) model that aims to learn node embeddings, which are low-dimensional representations of the nodes in the graph. The autoencoder is trained on the input graph, where the encoder learns to create node embeddings by aggregating the features of neighboring nodes, and the decoder tries to reconstruct the original graph from the node embeddings.
PyG 利用自动编码器解码器进行链接预测[2]。在 PyG 中,自动编码器是一个图神经网络(GNN)模型,旨在学习节点嵌入,即图中节点的低维表示。自动编码器在输入图上进行训练,其中编码器通过聚合相邻节点的特征来学习节点嵌入,解码器则尝试从节点嵌入中重建原始图。
After training the autoencoder on the input graph, the decoder is used for link prediction. The decoder can predict the likelihood of the existence of an edge between two nodes by computing the similarity of their node embeddings. Specifically, given two nodes’ embeddings, the decoder can output a score representing the probability of the existence of an edge between these nodes. If the score is above a certain threshold, the edge is predicted to exist; otherwise, it is predicted not to exist.
在输入图上训练自动编码器后,使用解码器进行链接预测。解码器可以通过计算两个节点嵌入的相似度来预测它们之间边的存在可能性。具体来说,给定两个节点的嵌入,解码器可以输出一个分数,表示这两个节点之间边存在的概率。如果分数高于某个阈值,则预测该边存在;否则,预测该边不存在。
PyG employs a random link split to partition the input graph into training, validation, and test sets. During training, the decoder is trained on the training set, and the model’s performance is evaluated on the validation set. After the model has been trained, it is used for link prediction on the test set.
PyG 采用随机链接拆分方法将输入图划分为训练集、验证集和测试集。在训练过程中,解码器在训练集上进行训练,而模型的性能在验证集上进行评估。模型训练完成后,用于在测试集上进行链接预测。
Overall, PyG’s approach to link prediction using autoencoder decoders involves learning node embeddings with an autoencoder and using these embeddings to predict edges’ existence between nodes.
总体而言,PyG 使用自动编码器解码器进行链接预测的方法涉及通过自动编码器学习节点嵌入,并使用这些嵌入来预测节点之间的边是否存在。
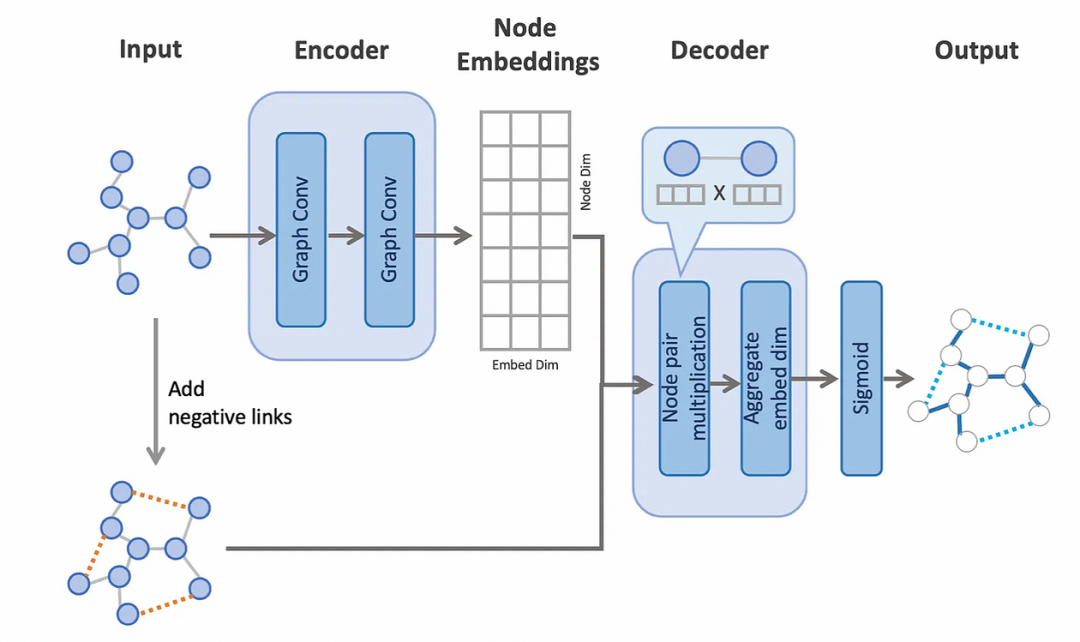
The prediction steps are described below:
预测步骤如下所述:
The process of creating node embeddings involves the utilization of an encoder that utilizes two convolution layers to process the graph.
创建节点嵌入的过程涉及使用一个编码器,该编码器利用两个卷积层来处理图。
To enable the model to perform binary classifications with positive links from the original edges and negative links from the added edges, we randomly add negative links to the original graph.
为了使模型能够对原始边中的正链接和添加边中的负链接执行二元分类,我们将负链接随机添加到原始图中。
The decoder performs link predictions (i.e., binary classifications) on all edges, including negative links, using the node embeddings. To achieve this, the decoder computes a dot product of the node embeddings from the pair of nodes on each edge, and subsequently aggregates the values across the embedding dimension. This results in a single value for each edge, representing the probability of edge existence.
解码器使用节点嵌入对所有边(包括负链接)执行链接预测(即二元分类)。为此,解码器计算每条边上一对节点节点嵌入的点积,并随后在嵌入维度上聚合这些值。这为每条边产生一个单一的值,表示边存在的概率。
Link Prediction Architecture
链接预测架构
The following image provides a summary of the edge split process for both the encoder and decoder, where only the colored edges are used in each stage.
下面的图像展示了编码器和解码器的边分割过程总结,每个阶段仅使用彩色边。
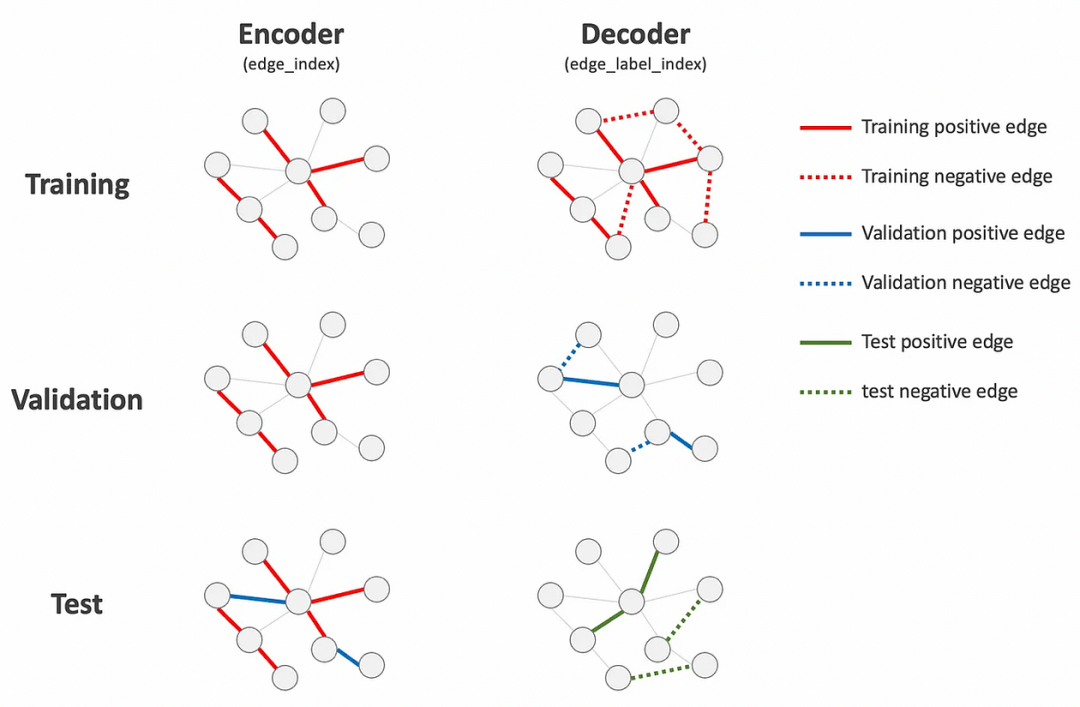
Edge Split for Auto-Encoder.
边拆分用于自动编码器。
Cuisines of Model Architectures
模型架构的菜系
GCN 图卷积网络
The GCN (Graph Convolutional Network)[3] is a type of convolutional neural network designed specifically for graph data. It operates by aggregating node features of neighboring nodes to compute node embeddings, which can then be used for various graph-based tasks such as node classification, link prediction, and graph classification.
GCN(图卷积网络)[3]是一种专门为图数据设计的卷积神经网络。它通过聚合邻近节点的特征来计算节点嵌入,这些嵌入可用于各种基于图的任务,如节点分类、链接预测和图分类。
In the context of link prediction, GCN is used to predict the presence or absence of edges between pairs of nodes in a graph. The process involves learning node embeddings using a GCN encoder and using these embeddings to predict the existence of edges between nodes using a GCN decoder.
在链接预测的背景下,GCN 用于预测图中节点对之间边的存在与否。该过程涉及使用 GCN 编码器学习节点嵌入,并使用这些嵌入通过 GCN 解码器预测节点之间的边是否存在。
The GCN encoder applies graph convolutions to the input graph by aggregating the features of a node’s neighbors and updating the node’s own feature representation. The process is repeated for each node, resulting in a set of node embeddings that represent the graph’s topology.
GCN 编码器通过对节点的邻居特征进行聚合并更新节点自身的特征表示,将图卷积应用于输入图。该过程对每个节点重复进行,最终得到一组表示图拓扑结构的节点嵌入。
Next, the GCN decoder utilizes the learned node embeddings to predict the existence of edges between pairs of nodes. This is done by computing a score for each potential edge between the embeddings of the two corresponding nodes. If the score exceeds a certain threshold, the edge is predicted to be present; otherwise, it is predicted to be absent.
接下来,GCN 解码器利用学习到的节点嵌入来预测节点对之间边的存在。这是通过计算两个对应节点嵌入之间每条潜在边的分数来完成的。如果分数超过某个阈值,则预测该边存在;否则,预测该边不存在。
Overall, GCN-based models for link prediction can be trained using a supervised learning approach, where the model is trained on a labeled dataset of positive and negative edges to learn the optimal edge-prediction function. This function can then be used to predict the existence of edges in unseen graphs.
总体而言,基于 GCN 的链接预测模型可以使用监督学习方法进行训练,该方法在包含正负边的标记数据集上训练模型,以学习最优的边预测函数。该函数随后可用于预测未见过图中的边是否存在。
Our PyG implementation looks like the following
我们的 PyG 实现如下
classNet(torch.nn.Module):
def__init__(self, in_channels, hidden_channels, out_channels):
super().__init__()
# The main GNN layers, two graph conv layers
        self.conv1 = GCNConv(in_channels, hidden_channels)
        self.conv2 = GCNConv(hidden_channels, out_channels)
def encode(self, x, edge_index):
x = self.conv1(x, edge_index).relu()
return self.conv2(x, edge_index) # Simple dot product based decoder
def decode(self, z, edge_label_index):
return (z[edge_label_index[0]] * z[edge_label_index[1]]).sum(dim=-1) # Want probabilities out to easily interpret results
def decode_all(self, z):
prob_adj = z @ z.t()
# Apply sigmoid function to get probabilities
prob_adj = torch.sigmoid(prob_adj)
return prob_adjmodel = Net(flavorGraph.num_features, 128, 64)
optimizer = torch.optim.Adam(params=model.parameters(), lr=0.01)
criterion = torch.nn.BCEWithLogitsLoss()
GraphSAGE
GraphSAGE is a type of graph neural network that learns node representations by aggregating feature information from its local neighborhood[4]. GraphSAGE can be used for link prediction by training the model to predict whether a given edge exists between two nodes in the graph.
GraphSAGE 是一种图神经网络,通过聚合其局部邻域的特征信息来学习节点表示[4]。GraphSAGE 可用于链接预测,通过训练模型来预测图中两个节点之间是否存在给定边。
To use GraphSAGE for link prediction, the first step is to preprocess the graph data by generating node features based on their local neighborhood. This is done by sampling a fixed number of neighbors for each node and aggregating their feature information using a trainable aggregation function. These aggregated features are then used as the input to a multi-layer perceptron (MLP) that outputs a score for each potential edge between pairs of nodes.
要使用图 SAGE 进行链接预测,第一步是通过基于节点的局部邻域生成节点特征来预处理图数据。这是通过为每个节点采样固定数量的邻居并使用可训练的聚合函数聚合它们的特征信息来完成的。然后,这些聚合特征被用作多层感知器(MLP)的输入,该感知器为节点对之间的每个潜在边输出一个分数。
The MLP can be trained in a supervised manner using a binary cross-entropy loss function that penalizes incorrect edge predictions. During training, the MLP learns to make edge predictions based on the local neighborhood features of each node pair.
MLP 可以使用二元交叉熵损失函数以监督方式训练,该函数会惩罚错误的边预测。在训练过程中,MLP 学习根据每个节点对局部邻域特征进行边预测。
Once the model is trained, it can be used to predict edges in new graphs by feeding in the local neighborhood features of the nodes in the graph and applying the trained MLP to predict the presence or absence of edges between node pairs.
模型训练完成后,可以通过输入图中节点的局部邻域特征,并应用训练好的 MLP 来预测新图中的边是否存在。
Overall, GraphSAGE has shown promising results in link prediction tasks and can be easily applied to a variety of graph-based applications such as social networks, recommendation systems, and knowledge graphs.
总体而言,GraphSAGE 在链接预测任务中表现出良好的效果,可以轻松应用于社交网络、推荐系统和知识图谱等各种基于图的场景。
Our PyG implementation for GraphSAGE can be found below:
我们的 PyG GraphSAGE 实现代码如下:
classNet(torch.nn.Module):
def__init__(self, in_channels, hidden_channels, out_channels):
super().__init__()
        self.conv1 = SAGEConv(in_channels, hidden_channels)
        self.conv2 = SAGEConv(hidden_channels, out_channels)
def encode(self, x, edge_index):
x = self.conv1(x, edge_index).relu()
return self.conv2(x, edge_index) def decode(self, z, edge_label_index):
return (z[edge_label_index[0]] * z[edge_label_index[1]]).sum(dim=-1) def decode_all(self, z):
prob_adj = z @ z.t()
# Apply sigmoid function to get probabilities
prob_adj = torch.sigmoid(prob_adj)
return prob_adjmodel = Net(flavorGraph.num_features, 128, 64)
optimizer = torch.optim.Adam(params=model.parameters(), lr=0.01)
criterion = torch.nn.BCEWithLogitsLoss()
Training (Turn On the Oven!)
训练(开启烤箱!)
Due to computational limitations, we utilized GCP resources provided by the course to train our models. For hyperparameters, we employed the Adam optimizer with a learning rate of 0.01. Our model architecture consisted of 2 layers of either GCN or GraphSAGE with a hidden embedding size of 32, as illustrated in our model architecture diagrams. We used BCEWithLogitsLoss and ROC-AUC metrics for our link prediction task. We trained both models for 150 epochs.
由于计算限制,我们使用了课程提供的 GCP 资源来训练我们的模型。对于超参数,我们采用了学习率为 0.01 的 Adam 优化器。我们的模型架构由 2 层 GCN 或 GraphSAGE 组成,隐藏嵌入大小为 32,如图所示。我们使用 BCEWithLogitsLoss 和 ROC-AUC 指标来进行链接预测任务。我们训练了两个模型共 150 个 epoch。
Here’s our training code 这是我们的训练代码
deftrain():
    model.train()
    optimizer.zero_grad()
    z = model.encode(train_data.x, train_data.edge_index)
# We perform a new round of negative sampling for every training epoch:
neg_edge_index = negative_sampling(
edge_index=train_data.edge_index, num_nodes=train_data.num_nodes,
num_neg_samples=train_data.edge_label_index.size(1), method='sparse') edge_label_index = torch.cat(
[train_data.edge_label_index, neg_edge_index],
dim=-1,
)
edge_label = torch.cat([
train_data.edge_label,
train_data.edge_label.new_zeros(neg_edge_index.size(1))
], dim=0) out = model.decode(z, edge_label_index).view(-1)
loss = criterion(out, edge_label)
loss.backward()
optimizer.step()
return loss
@torch.no_grad()
def test(data):
model.eval()
z = model.encode(data.x, data.edge_index)
out = model.decode(z, data.edge_label_index).view(-1).sigmoid()
y = data.edge_label.cpu().numpy()
pred = out.cpu().numpy()
return roc_auc_score(y, pred)validationMetrics_SAGE = []
best_val_auc = final_test_auc = 0
for epoch in range(1, 150):
loss = train()
val_auc = test(val_data)
test_auc = test(test_data)
if val_auc > best_val_auc:
best_val_auc = val_auc
final_test_auc = test_auc
validationMetrics_SAGE.append([val_auc, test_auc])
print(f'Epoch: {epoch:03d}, Loss: {loss:.4f}, Val: {val_auc:.4f}, '
f'Test: {test_auc:.4f}')print(f'Final Test: {final_test_auc:.4f}')z = model.encode(test_data.x, test_data.edge_index)
final_edge_probs_SAGE = model.decode_all(z)
The final plots after the training were:
训练后的最终图表如下:
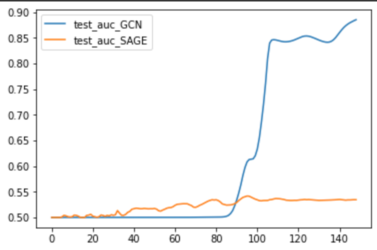
Test results for our GNN models.
我们 GNN 模型的测试结果。
Evaluation (The Taste Test)
评估(味觉测试)

Big Brother is watching
To evaluate the accuracy of our model in predicting ingredient pairings, we employed the ROC-AUC (Receiver Operating Characteristic — Area Under the Curve) metric. This metric measures the area under the curve of the true positive rate against the false positive rate curve. GraphSAGE gave test AUC between 50–55%, whereas GCN blew the metric out of the frying pot by achieving test accuracies close to 90%. This makes sense as GCN generally perform better than GraphSAGE in scenarios where the graph has a homogeneous structure, meaning the nodes have a similar role and connectivity patterns across the graph. GCN’s message-passing mechanism, which uses a fixed filter over the graph, is particularly effective in capturing such homogeneous structure.
为了评估我们的模型在预测食材搭配方面的准确性,我们采用了 ROC-AUC(接收者操作特征—曲线下面积)指标。该指标测量的是真阳性率曲线相对于假阳性率曲线下的面积。GraphSAGE 在测试中的 AUC 值在 50-55%之间,而 GCN 则将这一指标远远抛在身后,实现了接近 90%的测试准确率。这很合理,因为 GCN 通常在图具有同质结构的情况下表现优于 GraphSAGE,这意味着图的节点具有相似的角色和连接模式。GCN 的消息传递机制,它使用固定的滤波器对图进行处理,特别擅长捕捉这种同质结构。
While some of our recipe predictions make sense (using {tortilla, pepper, green onion, garlic powder, egg, and soy sauce} or {almond half, almond syrup, and apple smoked bacon), some clearly do not! For eg {ground beef, acorn, cream of mushroom soup, and tortilla} is simply a crime against humanity. Identifying subgraphs instead of using link prediction for recipe prediction might make some recipes less weird, as that would look at the overall interaction between ingredients rather than just looking at which ingredient does our most recent ingredient go best with.
虽然我们的一些食谱预测是有道理的(使用{玉米饼、辣椒、葱、大蒜粉、鸡蛋和酱油}或{杏仁半块、杏仁糖浆和苹果熏熏培根}),但有些显然是不行的!例如{碎牛肉、橡子、蘑菇汤和玉米饼}简直是对人类犯下的罪行。识别子图而不是使用链接预测来进行食谱预测可能会让一些食谱不那么奇怪,因为那样会考虑食材之间的整体相互作用,而不是只看哪个食材与我们的最新食材最搭配。
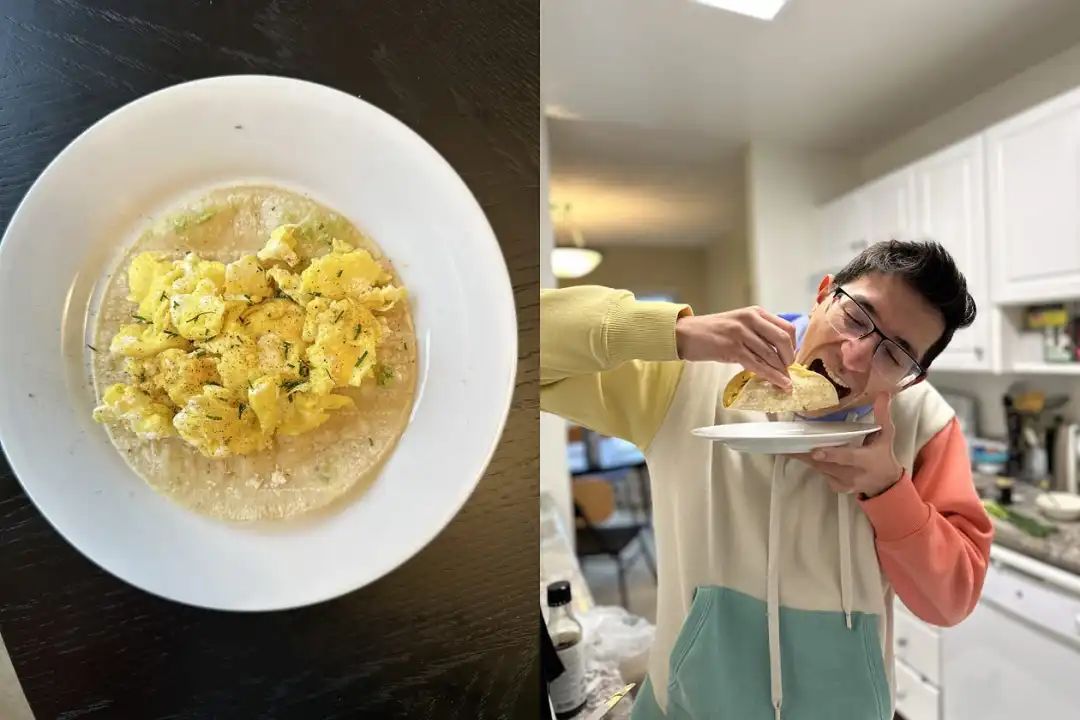
Our algorithm makes amazing tacos!
我们的算法做出了惊人的玉米饼!
参考文献
[1] Park, D., Kim, K., Kim, S. et al. FlavorGraph: a large-scale food-chemical graph for generating food representations and recommending food pairings. Sci Rep 11, 931 (2021).
[2] Thomas N. Kipf, Max Welling, Variational Graph Auto-Encoders (2016)
[3] Kipf, T.N. & Welling, M. Semi-Supervised Classification with Graph Convolutional Networks (2017).
[4] Hamilton, W.L. & Ying, R. & Leskovec, J. Inductive Representation Learning on Large Graphs (2018).


内容中包含的图片若涉及版权问题,请及时与我们联系删除
评论
沙发等你来抢